Fig. 6.
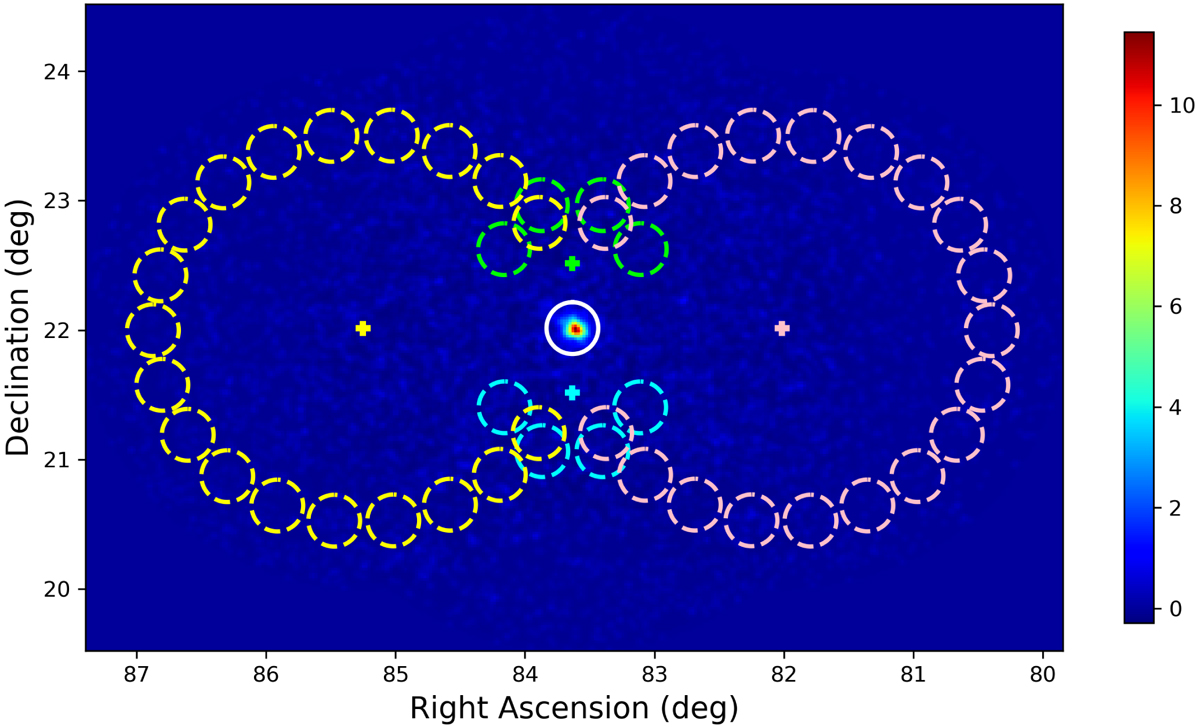
Background-subtracted counts map of the Crab nebula observations for the energy band 670 GeV–30 TeV. The map was computed for a 0.02° ×0.02° binning and was smoothed with a Gaussian kernel of σ = 0.02° to reduce statistical noise. The colour bar represents the number of excess counts per bin. The white circle indicates the On region selected for On-Off analysis, coloured dashed circles are the corresponding Off regions and plus symbols the pointing directions, where each colour corresponds to one of the four observations. Coordinates are for the epoch J2000.
Current usage metrics show cumulative count of Article Views (full-text article views including HTML views, PDF and ePub downloads, according to the available data) and Abstracts Views on Vision4Press platform.
Data correspond to usage on the plateform after 2015. The current usage metrics is available 48-96 hours after online publication and is updated daily on week days.
Initial download of the metrics may take a while.