Open Access
Fig. E.24.
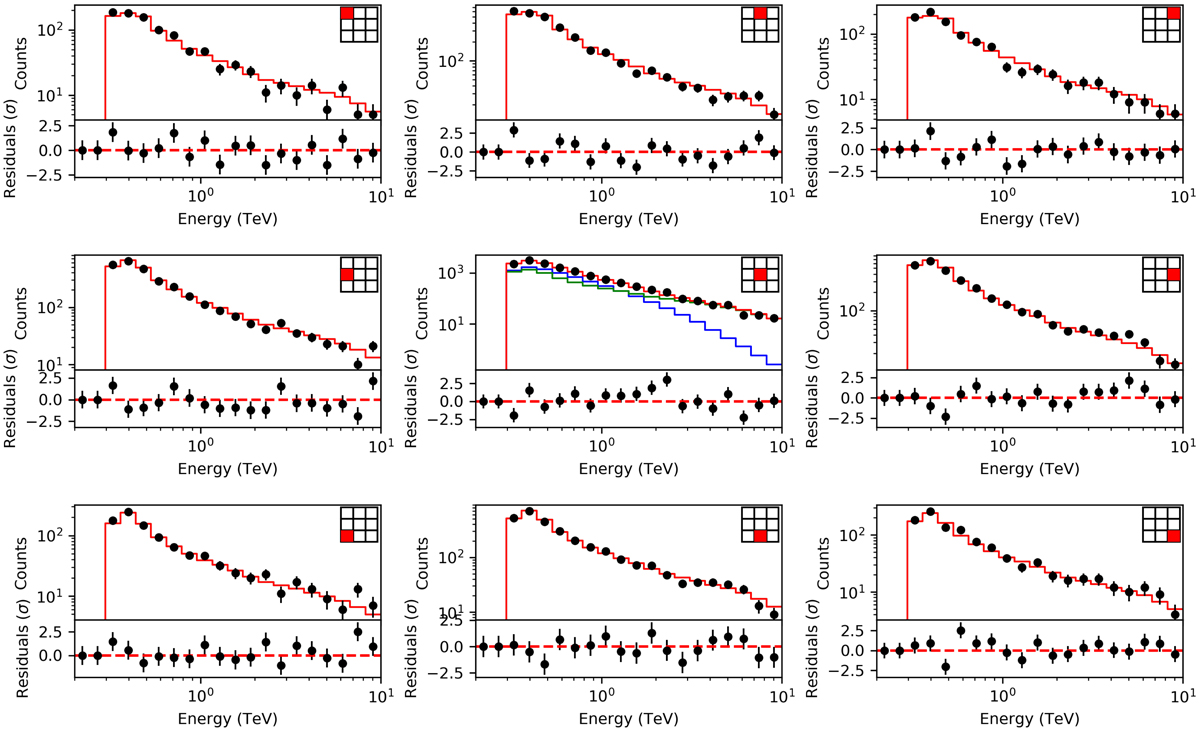
Sub-region counts spectra and residuals spectra for the PKS 2155–304 observations. Red lines represent the total predicted model counts, blue lines the predicted source counts and green lines the predicted background counts.
Current usage metrics show cumulative count of Article Views (full-text article views including HTML views, PDF and ePub downloads, according to the available data) and Abstracts Views on Vision4Press platform.
Data correspond to usage on the plateform after 2015. The current usage metrics is available 48-96 hours after online publication and is updated daily on week days.
Initial download of the metrics may take a while.