Fig. E.21.
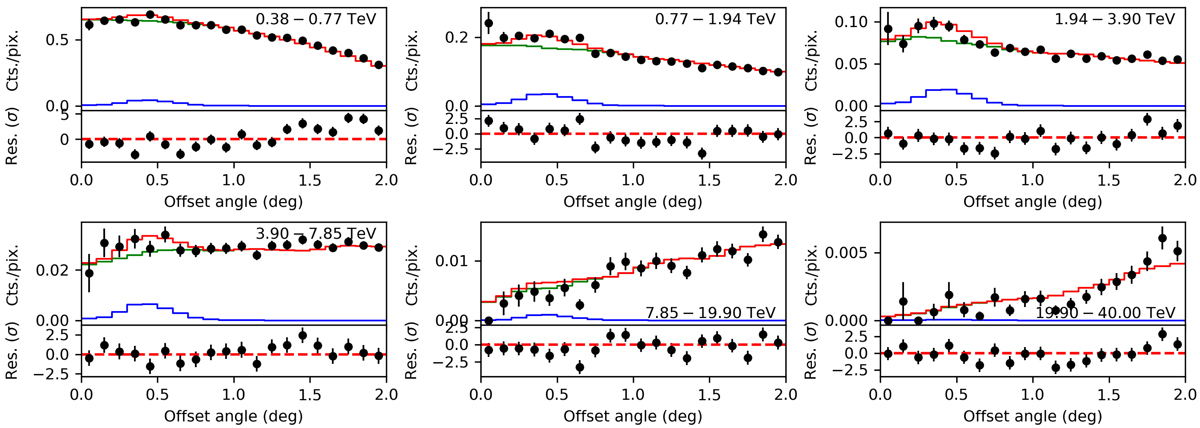
Radial counts profiles and residuals for the MSH 15–52 observations fitted using a source model with an exponentially cut-off power-law spectrum. Red lines represent the total predicted model counts, blue lines the predicted source counts and green lines the predicted background counts. To determine the profiles, the MSH 15–52 observations were stacked in the field-of-view coordinate system; the source counts are located around the offset angle θ = 0.5° under which the source was observed.
Current usage metrics show cumulative count of Article Views (full-text article views including HTML views, PDF and ePub downloads, according to the available data) and Abstracts Views on Vision4Press platform.
Data correspond to usage on the plateform after 2015. The current usage metrics is available 48-96 hours after online publication and is updated daily on week days.
Initial download of the metrics may take a while.