Open Access
Fig. 4.
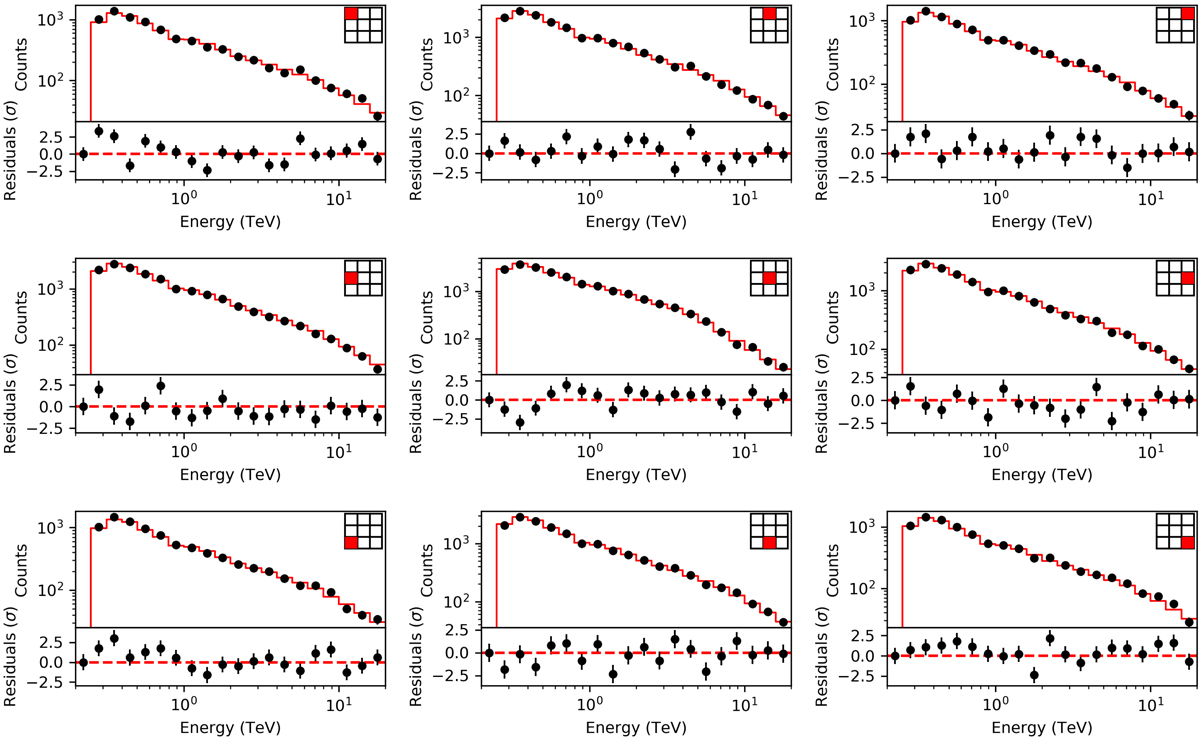
Counts spectra and residuals for nine spatial sub-regions of the field of view for all 45 empty-field observations stacked in the field-of-view coordinate system. The location of each sub-region in the field of view is indicated by the red box in the 3 × 3 grid that is displayed in each panel.
Current usage metrics show cumulative count of Article Views (full-text article views including HTML views, PDF and ePub downloads, according to the available data) and Abstracts Views on Vision4Press platform.
Data correspond to usage on the plateform after 2015. The current usage metrics is available 48-96 hours after online publication and is updated daily on week days.
Initial download of the metrics may take a while.