Fig. 3.
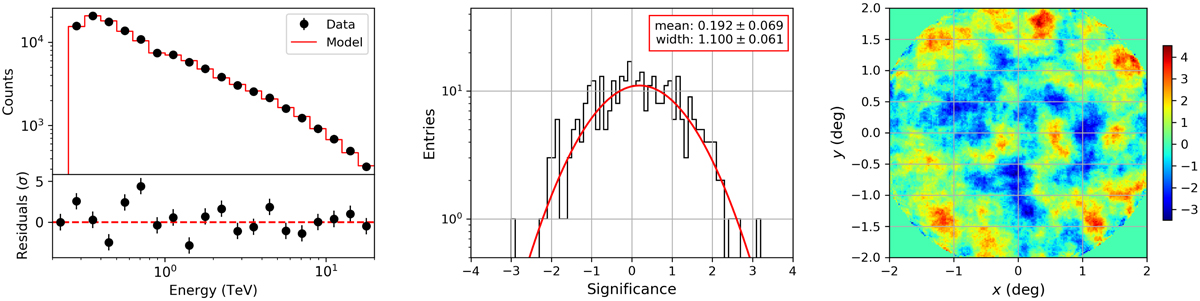
Stacked residuals of all 45 empty-field observations after fitting the csbkgmodel background model to each individual observation. Left panel: residual count spectrum after summing over the entire field of view. Centre panel: histogram of significances, determined after summing over energy and by sampling the events into bins of 0.2° ×0.2°. Right panel: residual map in the field-of-view coordinate system. The residual map is summed over all energies and was computed for a correlation radius of 0.2°. Residuals are shown in units of significance expressed in Gaussian σ and are computed using Eqs. (A.3) and (A.4).
Current usage metrics show cumulative count of Article Views (full-text article views including HTML views, PDF and ePub downloads, according to the available data) and Abstracts Views on Vision4Press platform.
Data correspond to usage on the plateform after 2015. The current usage metrics is available 48-96 hours after online publication and is updated daily on week days.
Initial download of the metrics may take a while.