Fig. 22.
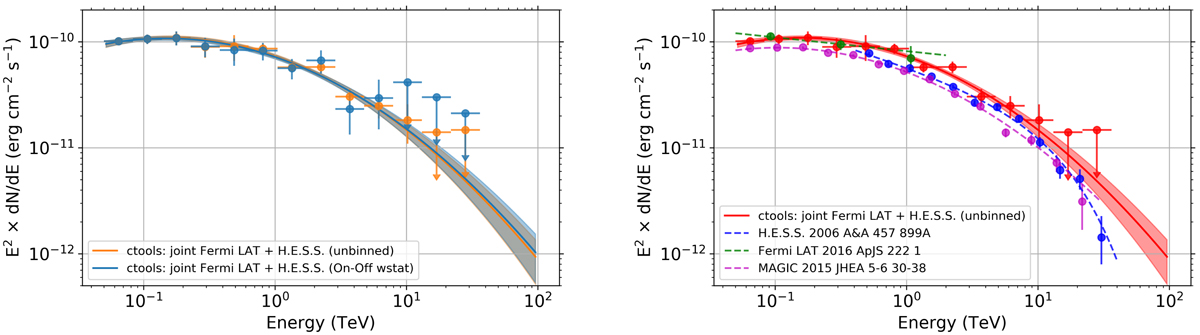
Left: SED of the Crab nebula derived from the joint analysis of Fermi-LAT and H.E.S.S. data above 50 GeV. H.E.S.S. data were analysed using two different methods, unbinned and On-Off with wstat statistics (see Sect. 2.4). Lines represent the best-fit curved power-law spectral models over the entire energy range, and the shaded bands represent the 68% confidence-level uncertainty bands of the spectral models determined using ctbutterfly. Upper limits from the On-Off analysis at the highest energies are above the maximum flux shown in the plot. Right: best-fit curved power-law model and SED derived from our joint analysis of LAT and H.E.S.S. data (with unbinned analysis of H.E.S.S. data), compared to published results from H.E.S.S. only (Aharonian et al. 2006a), Fermi-LAT only above 50 GeV (Ackermann et al. 2016), and MAGIC (Aleksić et al. 2015).
Current usage metrics show cumulative count of Article Views (full-text article views including HTML views, PDF and ePub downloads, according to the available data) and Abstracts Views on Vision4Press platform.
Data correspond to usage on the plateform after 2015. The current usage metrics is available 48-96 hours after online publication and is updated daily on week days.
Initial download of the metrics may take a while.