Fig. 19.
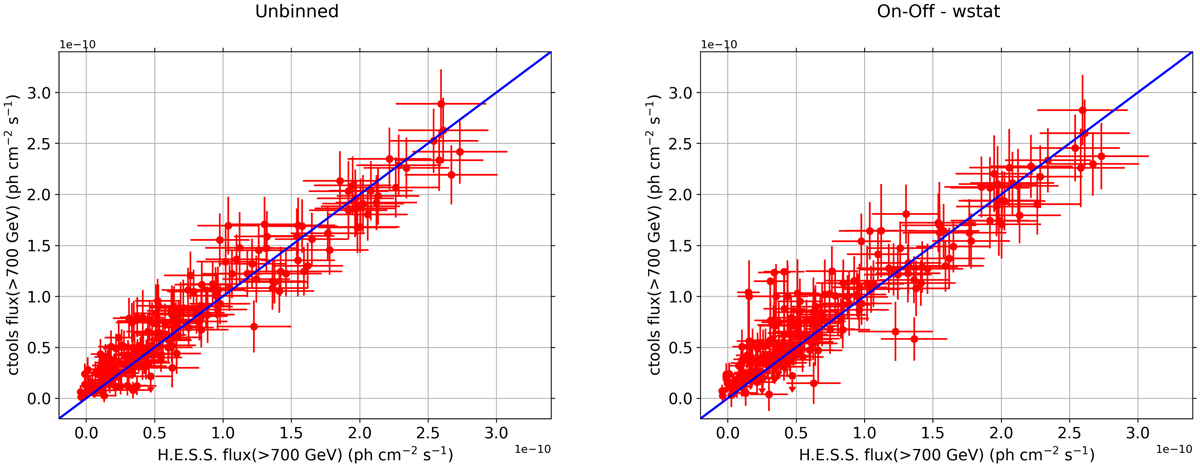
Correlation of PKS 2155–304 light curve fluxes obtained by Aharonian et al. (2009) (horizontal axis) with fluxes obtained by ctools (vertical axis). The left plot shows results for the unbinned maximum likelihood analysis, and the right plot shows results obtained for an On-Off analysis with background estimates taken from Off regions. The blue line indicates equal fluxes.
Current usage metrics show cumulative count of Article Views (full-text article views including HTML views, PDF and ePub downloads, according to the available data) and Abstracts Views on Vision4Press platform.
Data correspond to usage on the plateform after 2015. The current usage metrics is available 48-96 hours after online publication and is updated daily on week days.
Initial download of the metrics may take a while.