Fig. 14.
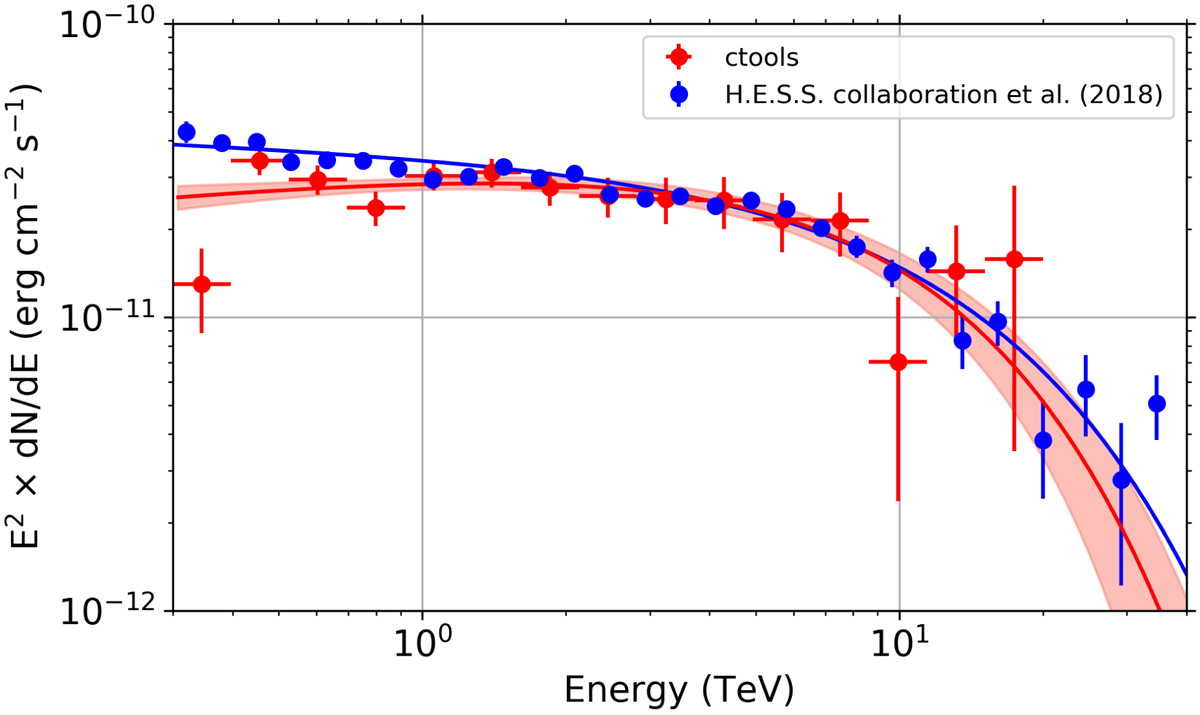
SED of RX J1713.7–3946 derived using csspec. Red data represent the unbinned ctools analysis, blue data are the values from Table F.1 of H.E.S.S. Collaboration (2018b). 68% confidence level upper limits are displayed when the statistical error exceeds the value of a flux point. The red line is the fitted exponentially cut-off power-law spectral model, the light red band is the 68% confidence level uncertainty band of the spectral model and was determined using ctbutterfly. The blue line is the exponentially cut-off power-law spectral model determined by H.E.S.S. Collaboration (2018b).
Current usage metrics show cumulative count of Article Views (full-text article views including HTML views, PDF and ePub downloads, according to the available data) and Abstracts Views on Vision4Press platform.
Data correspond to usage on the plateform after 2015. The current usage metrics is available 48-96 hours after online publication and is updated daily on week days.
Initial download of the metrics may take a while.