Fig. 10.
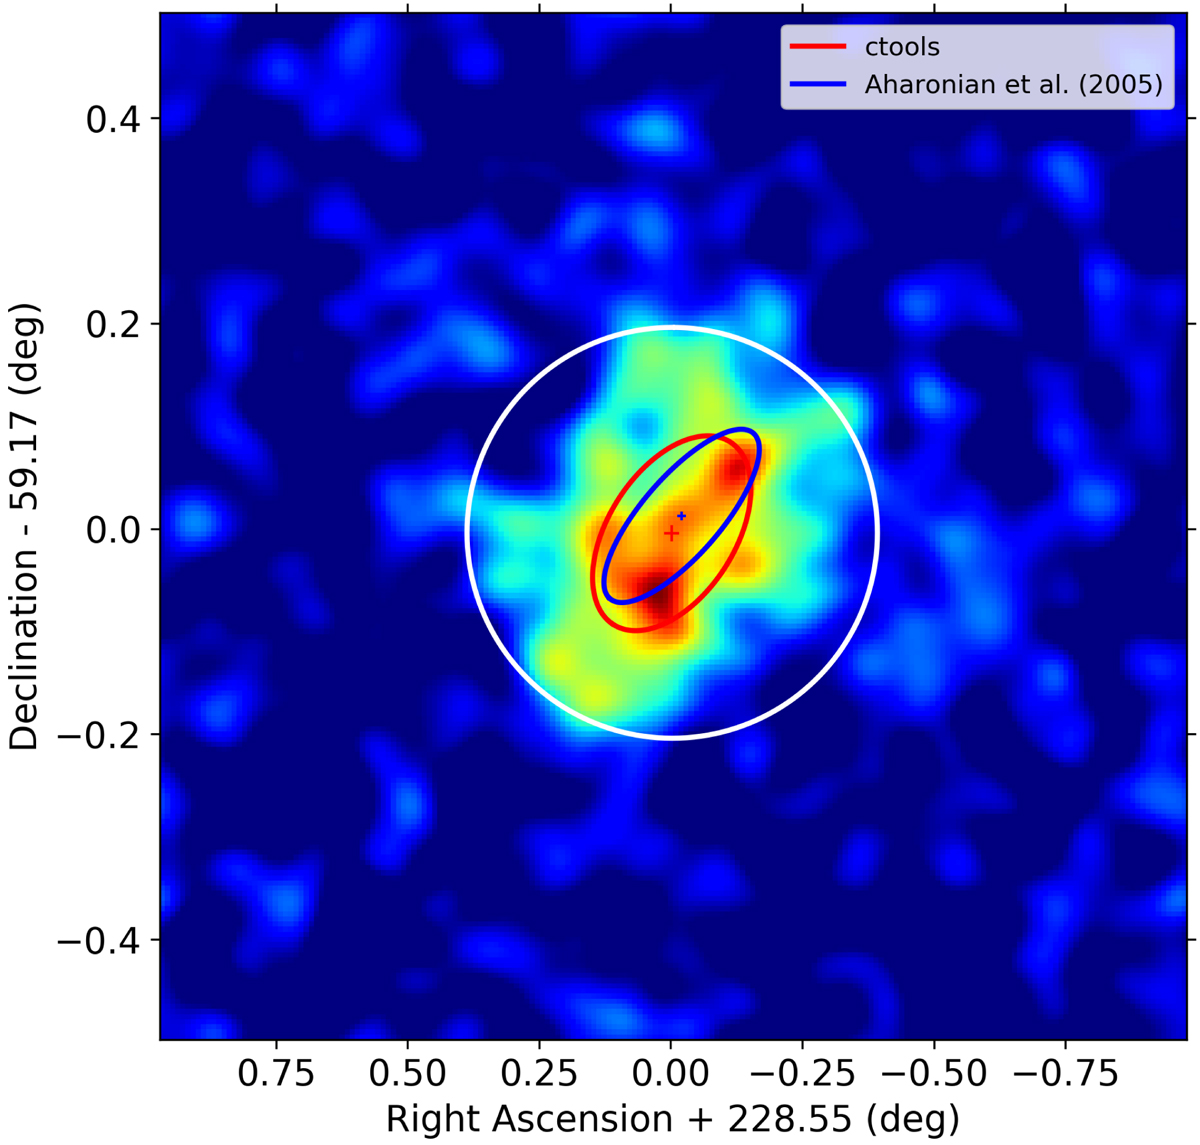
Background-subtracted counts map of the MSH 15–52 observations for the energy band 381 GeV–40 TeV. The map was computed for a 0.005° ×0.005° binning and was smoothed with a Gaussian kernel of σ = 0.02° to reduce statistical noise. The 1σ contour of the elliptical Gaussian fitted using ctools is indicated as a red ellipse. The fit results from Aharonian et al. (2005) are indicated as a blue ellipse. The crosses indicate the statistical uncertainty in the centroid positions. The white circle indicates the On region used in the On-Off analysis. Coordinates are for the epoch J2000.
Current usage metrics show cumulative count of Article Views (full-text article views including HTML views, PDF and ePub downloads, according to the available data) and Abstracts Views on Vision4Press platform.
Data correspond to usage on the plateform after 2015. The current usage metrics is available 48-96 hours after online publication and is updated daily on week days.
Initial download of the metrics may take a while.