Fig. 5.
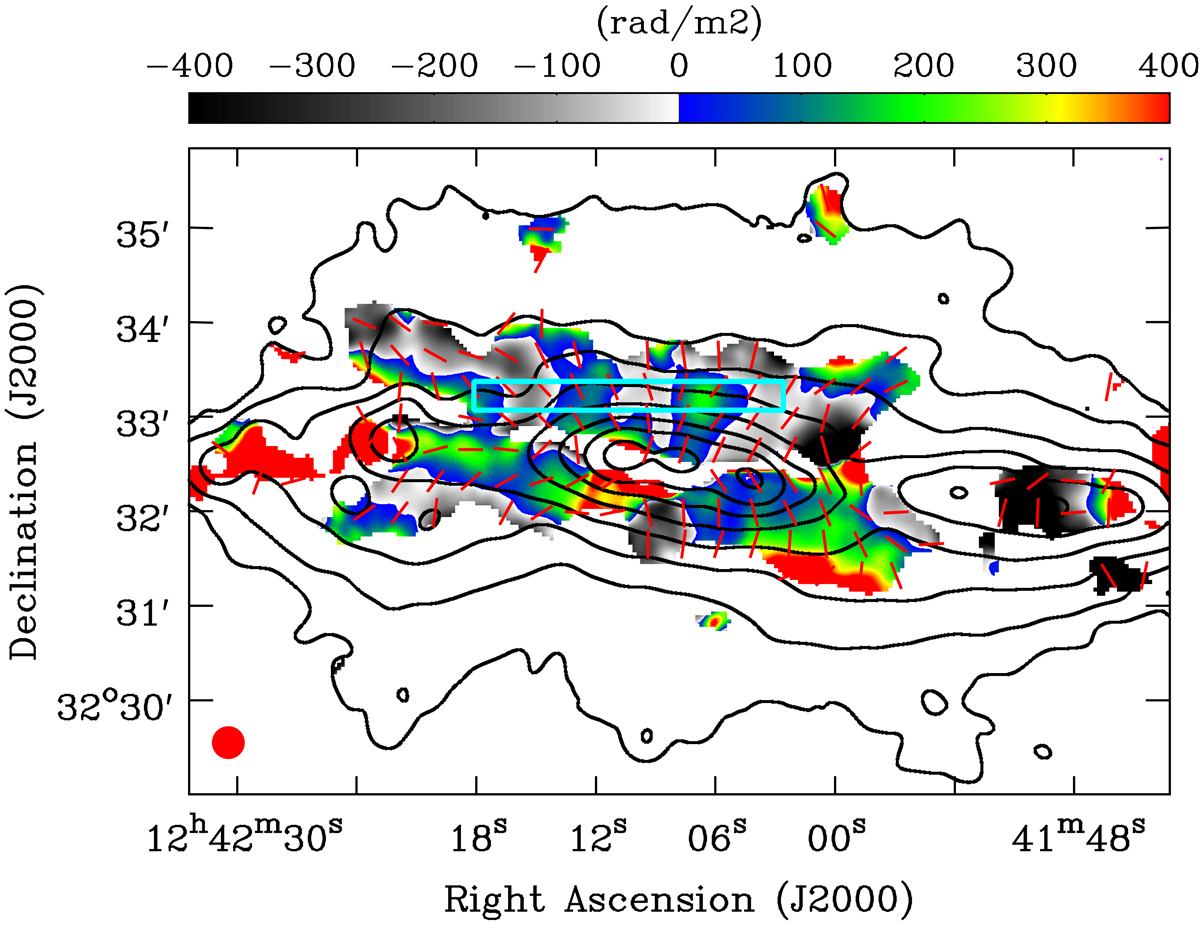
Colorscale of the Faraday depth obtained from C-band (VLA D-configuration) data, together with the intrinsic magnetic field orientation (line segments of equal length) at C-band. Faraday depth and polarization angles were calculated at pixels where the C-band polarized intensity is larger than 5σ. All data plotted have an angular resolution of ![]() FWHM. Black contours corresponding to the 5.99 GHz total power emission (VLA + Effelsberg) are at 45 μJy beam−1 × (3, 6, 12, 24, 48, 96, 192, 384), refer to Mora-Partiarroyo et al. (2019) for details concerning the total intensity emission. The blue rectangular box indicates the region from which the Faraday depth profile shown in Fig. 6 was extracted.
FWHM. Black contours corresponding to the 5.99 GHz total power emission (VLA + Effelsberg) are at 45 μJy beam−1 × (3, 6, 12, 24, 48, 96, 192, 384), refer to Mora-Partiarroyo et al. (2019) for details concerning the total intensity emission. The blue rectangular box indicates the region from which the Faraday depth profile shown in Fig. 6 was extracted.
Current usage metrics show cumulative count of Article Views (full-text article views including HTML views, PDF and ePub downloads, according to the available data) and Abstracts Views on Vision4Press platform.
Data correspond to usage on the plateform after 2015. The current usage metrics is available 48-96 hours after online publication and is updated daily on week days.
Initial download of the metrics may take a while.