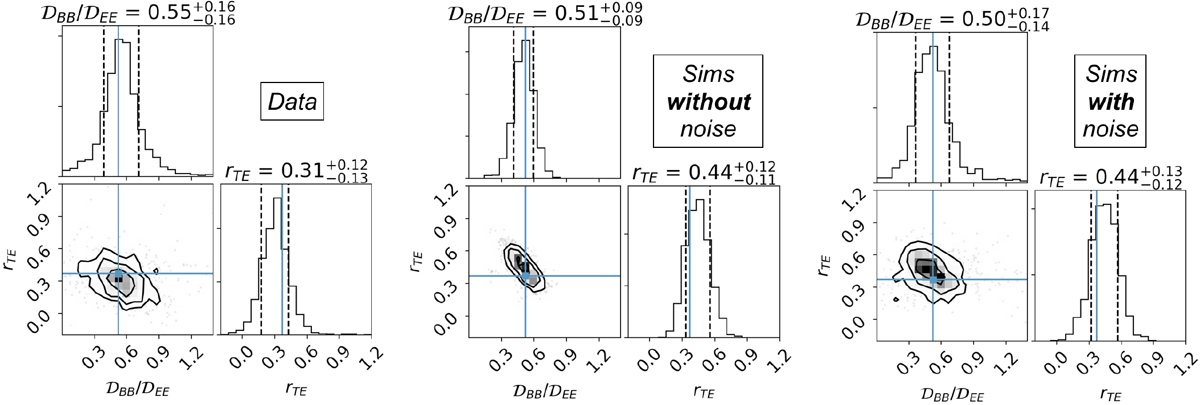
Fig. A.2

Probability density functions (pdf, 1D and 2D) of rTE and ![]() only for bin 2 and bin 3 together with 1, 2, and 3σ contour levels for the observed data (left panel), the simulations without Planck noise (central panel), and the simulations with Planck noise added (right panel). The blue lines indicate the observed values in P16XXX and P18XI of
only for bin 2 and bin 3 together with 1, 2, and 3σ contour levels for the observed data (left panel), the simulations without Planck noise (central panel), and the simulations with Planck noise added (right panel). The blue lines indicate the observed values in P16XXX and P18XI of ![]() and rTE = 0.36. On top of the 1D pdf the mean values and standard deviations (also represented by black vertical dashed lines) are shown. These plots were made with the PYTHON CORNER package (Foreman-Mackey 2016).
and rTE = 0.36. On top of the 1D pdf the mean values and standard deviations (also represented by black vertical dashed lines) are shown. These plots were made with the PYTHON CORNER package (Foreman-Mackey 2016).
Current usage metrics show cumulative count of Article Views (full-text article views including HTML views, PDF and ePub downloads, according to the available data) and Abstracts Views on Vision4Press platform.
Data correspond to usage on the plateform after 2015. The current usage metrics is available 48-96 hours after online publication and is updated daily on week days.
Initial download of the metrics may take a while.


