Fig. A.1.
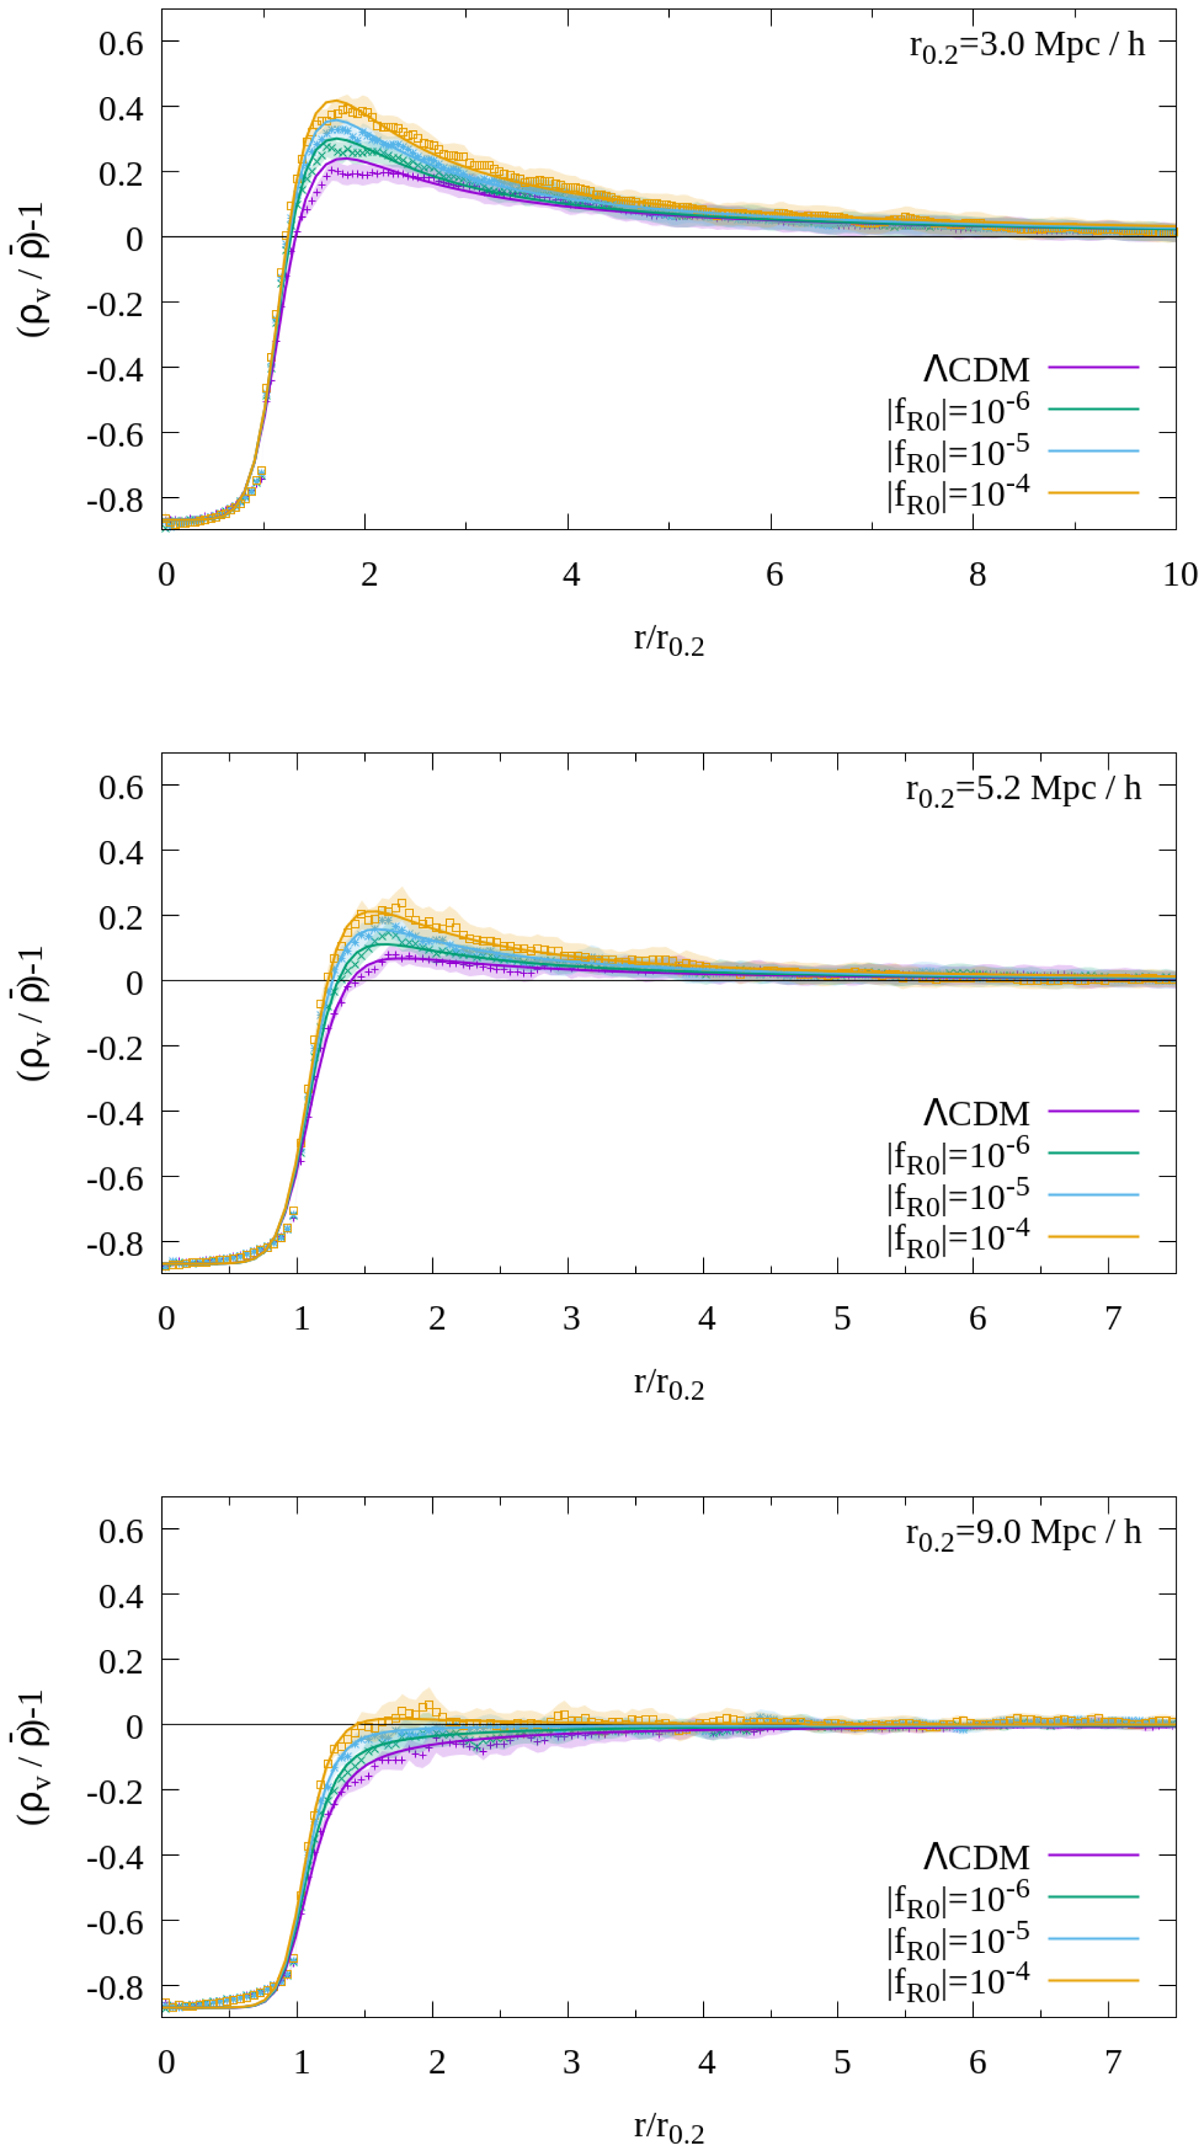
Void density profiles measured in the f(R) simulations (points), and best fit of the model in Eq. (16) (lines). We split the void catalog into seven subsamples, corresponding to different void sizes, then we stacked all the void density-profiles for each subsample. Here we show the stacked subsamples with mean radius r0.2 = 3.0 Mpc h−1 (top panel), 5.2 Mpc h−1 (middle panel), and 9.0 Mpc h−1 (bottom panel).
Current usage metrics show cumulative count of Article Views (full-text article views including HTML views, PDF and ePub downloads, according to the available data) and Abstracts Views on Vision4Press platform.
Data correspond to usage on the plateform after 2015. The current usage metrics is available 48-96 hours after online publication and is updated daily on week days.
Initial download of the metrics may take a while.