Free Access
Fig. 9.
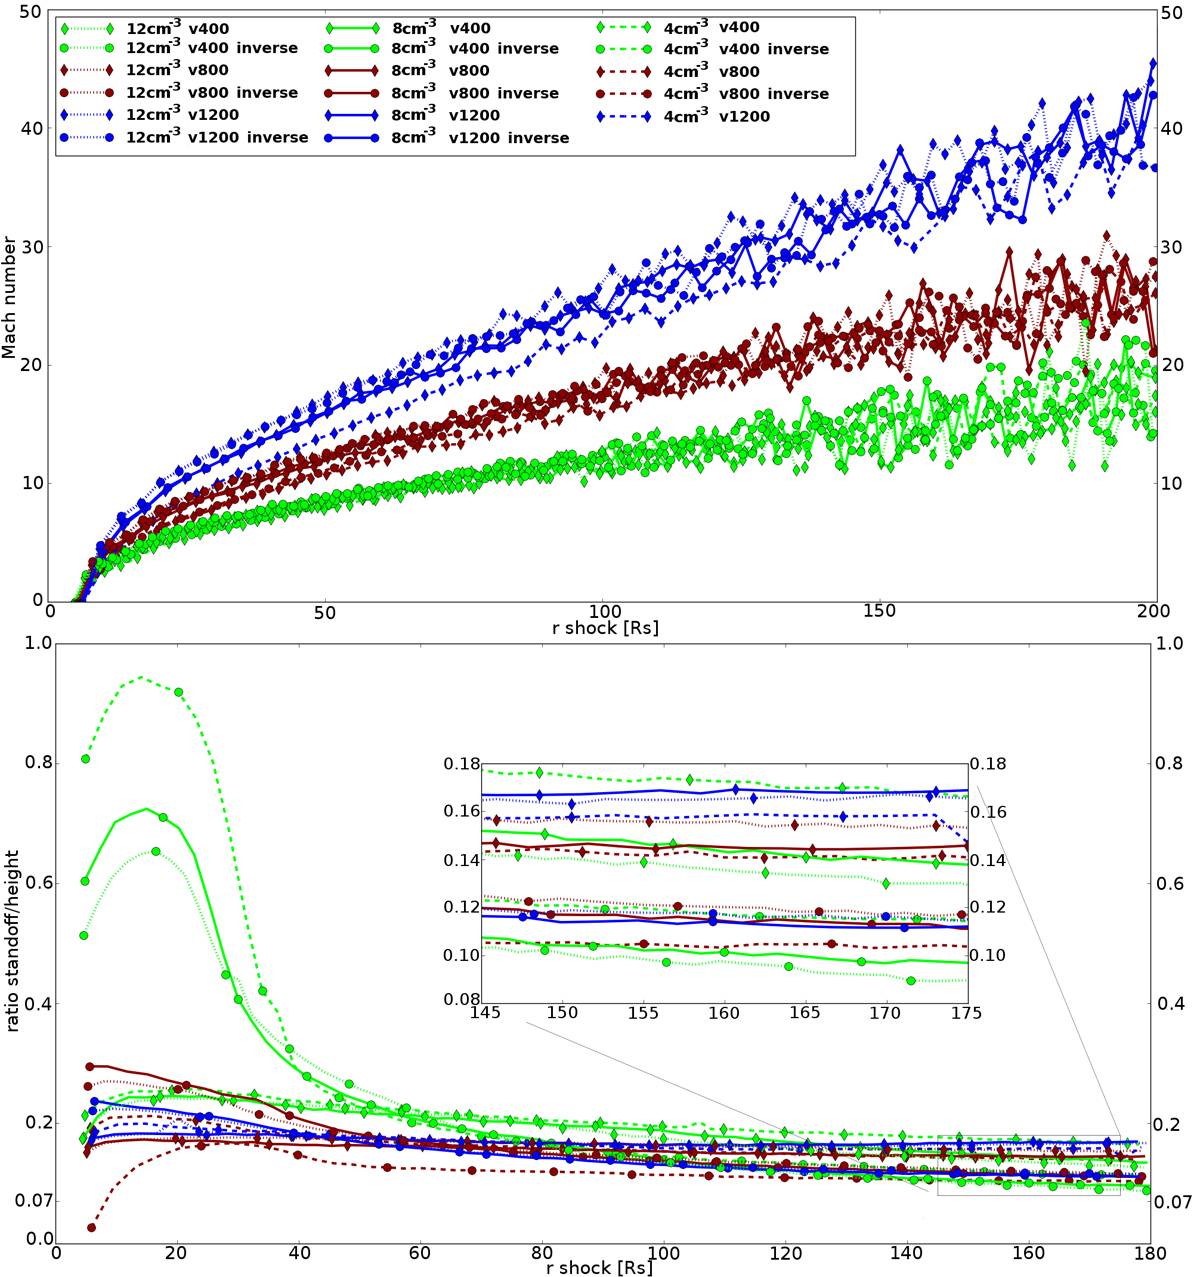
Upper panel: Alfvén Mach number at the location of the shock along the ecliptic for all simulations. Lower panel: ratio of stand-off distance to height. Polarity is represented by diamonds for normal CMEs and dots for inverse CMEs (one symbol is shown for every five data points).
Current usage metrics show cumulative count of Article Views (full-text article views including HTML views, PDF and ePub downloads, according to the available data) and Abstracts Views on Vision4Press platform.
Data correspond to usage on the plateform after 2015. The current usage metrics is available 48-96 hours after online publication and is updated daily on week days.
Initial download of the metrics may take a while.