Fig. 8.
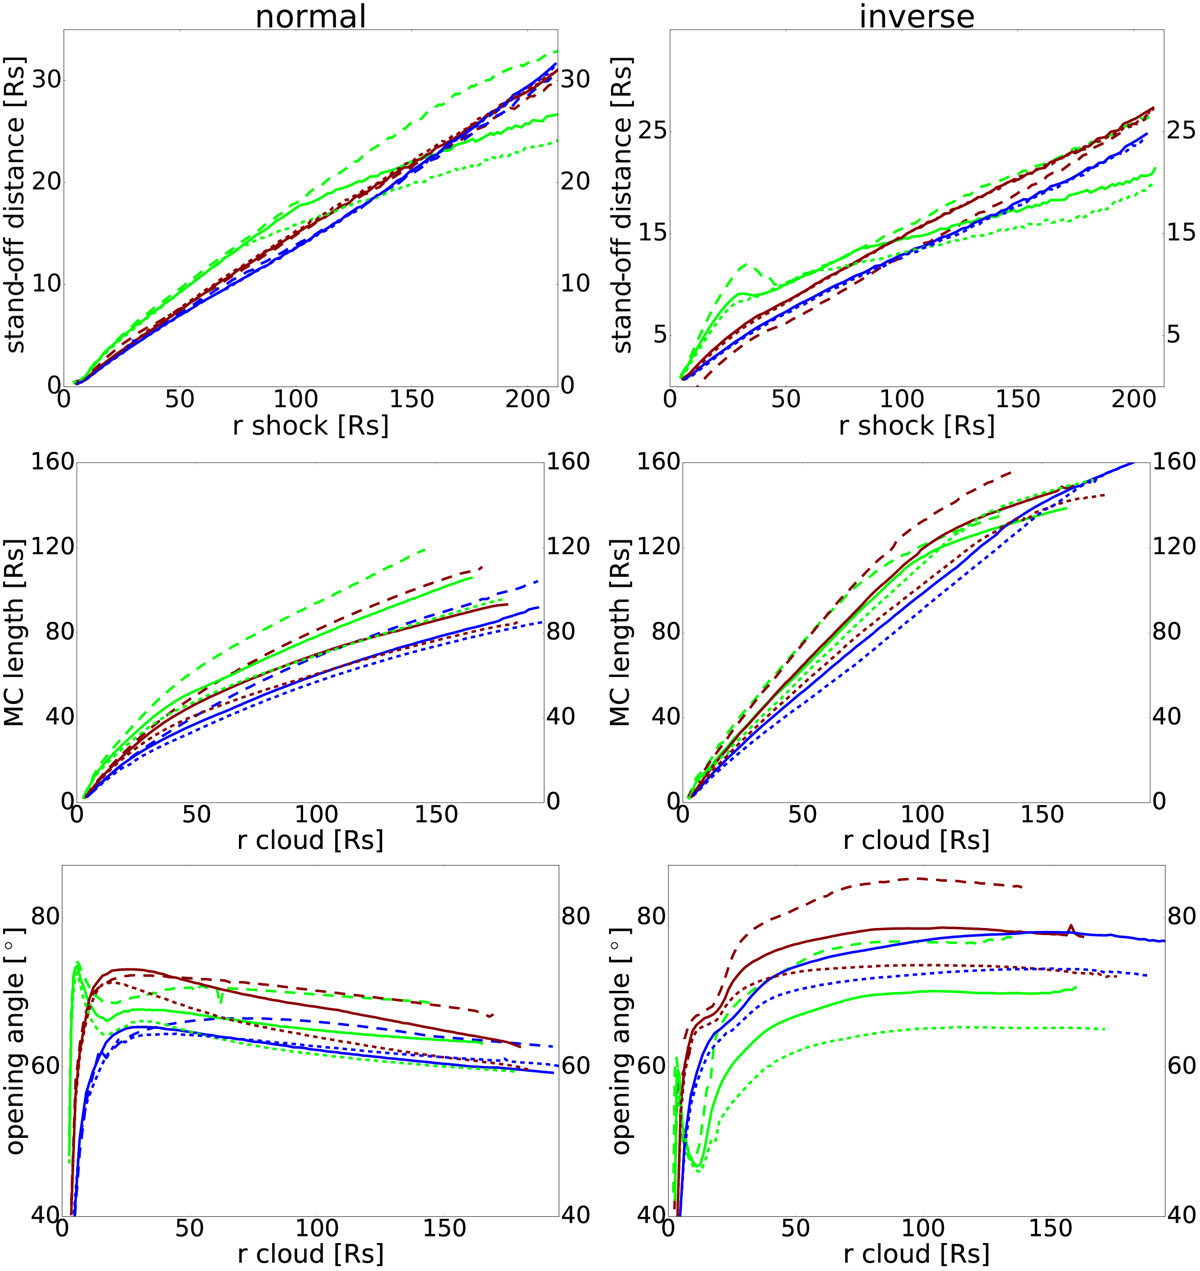
Properties for all normal CMEs and for all inverse CMEs (left and right, respectively). The colours represent different initial velocities (green: 400 km s−1, red: 800 km s−1, blue: 1200 km s−1), while the line-styles represent different background wind densities (dashed: 4 cm−3, solid: 8 cm−3, dotted: 12 cm−3). From top to bottom, the y-axes represents the stand-off distance, the length of and the height of the separatrix of the CME, respectively. The x-axis in the first row represents the position of the shock, while the x-axis of the second and third rows represent the position of the centre of the magnetic cloud. Both columns have the same scale to facilite comparisons.
Current usage metrics show cumulative count of Article Views (full-text article views including HTML views, PDF and ePub downloads, according to the available data) and Abstracts Views on Vision4Press platform.
Data correspond to usage on the plateform after 2015. The current usage metrics is available 48-96 hours after online publication and is updated daily on week days.
Initial download of the metrics may take a while.