Fig. 7.
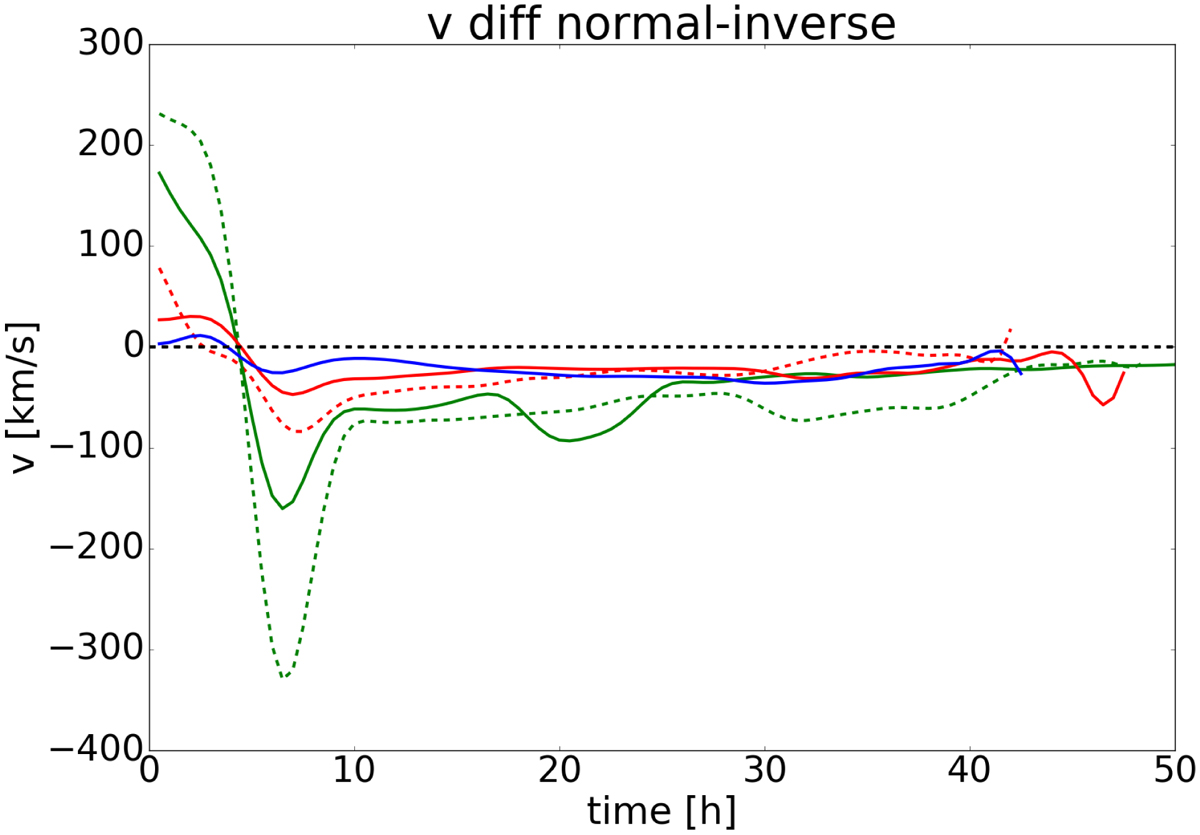
Velocity difference of the MC front between normal and inverse CMEs with the same initial velocity ejected in the same background wind vs. time. The colours represent different initial velocities (green: 400 km s−1, red: 800 km s−1, blue: 1200 km s−1), while the line styles represent different background wind densities (dashed: 4 cm−3, solid: 8 cm−3). The black dotted line represents vdiff = 0.
Current usage metrics show cumulative count of Article Views (full-text article views including HTML views, PDF and ePub downloads, according to the available data) and Abstracts Views on Vision4Press platform.
Data correspond to usage on the plateform after 2015. The current usage metrics is available 48-96 hours after online publication and is updated daily on week days.
Initial download of the metrics may take a while.