Fig. 5.
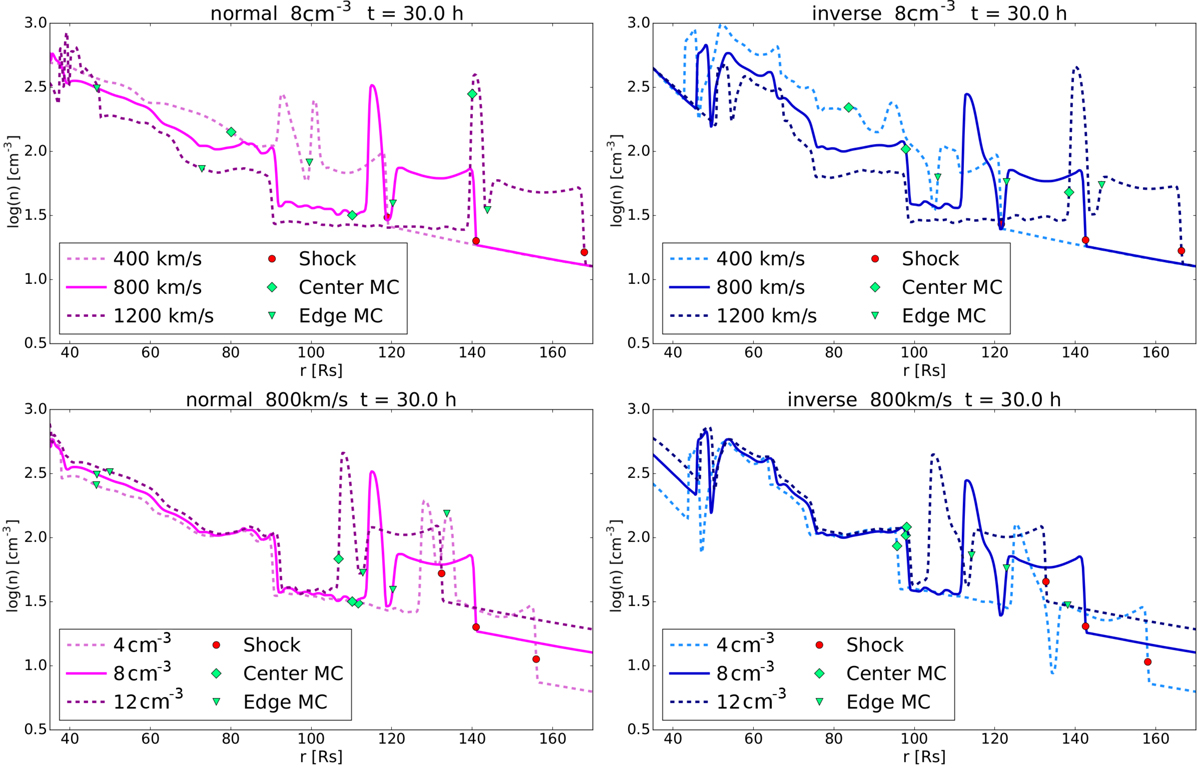
Number density of the radial cross section at the equator 30 h after ejection for normal CMEs in the left column and inverse CMEs in the right column. In the upper panels, a medium density background wind was chosen for three different initial velocities of the CME. In the lower panels, a CME with an initial velocity of 800 km s−1 was ejected in three different background winds (indicated with the different line styles). The red dots represent the location of the CME shock front, the green diamonds represent the position of the centre of the magnetic cloud, and the green triangles represent the edges of the magnetic cloud.
Current usage metrics show cumulative count of Article Views (full-text article views including HTML views, PDF and ePub downloads, according to the available data) and Abstracts Views on Vision4Press platform.
Data correspond to usage on the plateform after 2015. The current usage metrics is available 48-96 hours after online publication and is updated daily on week days.
Initial download of the metrics may take a while.