Fig. 13.
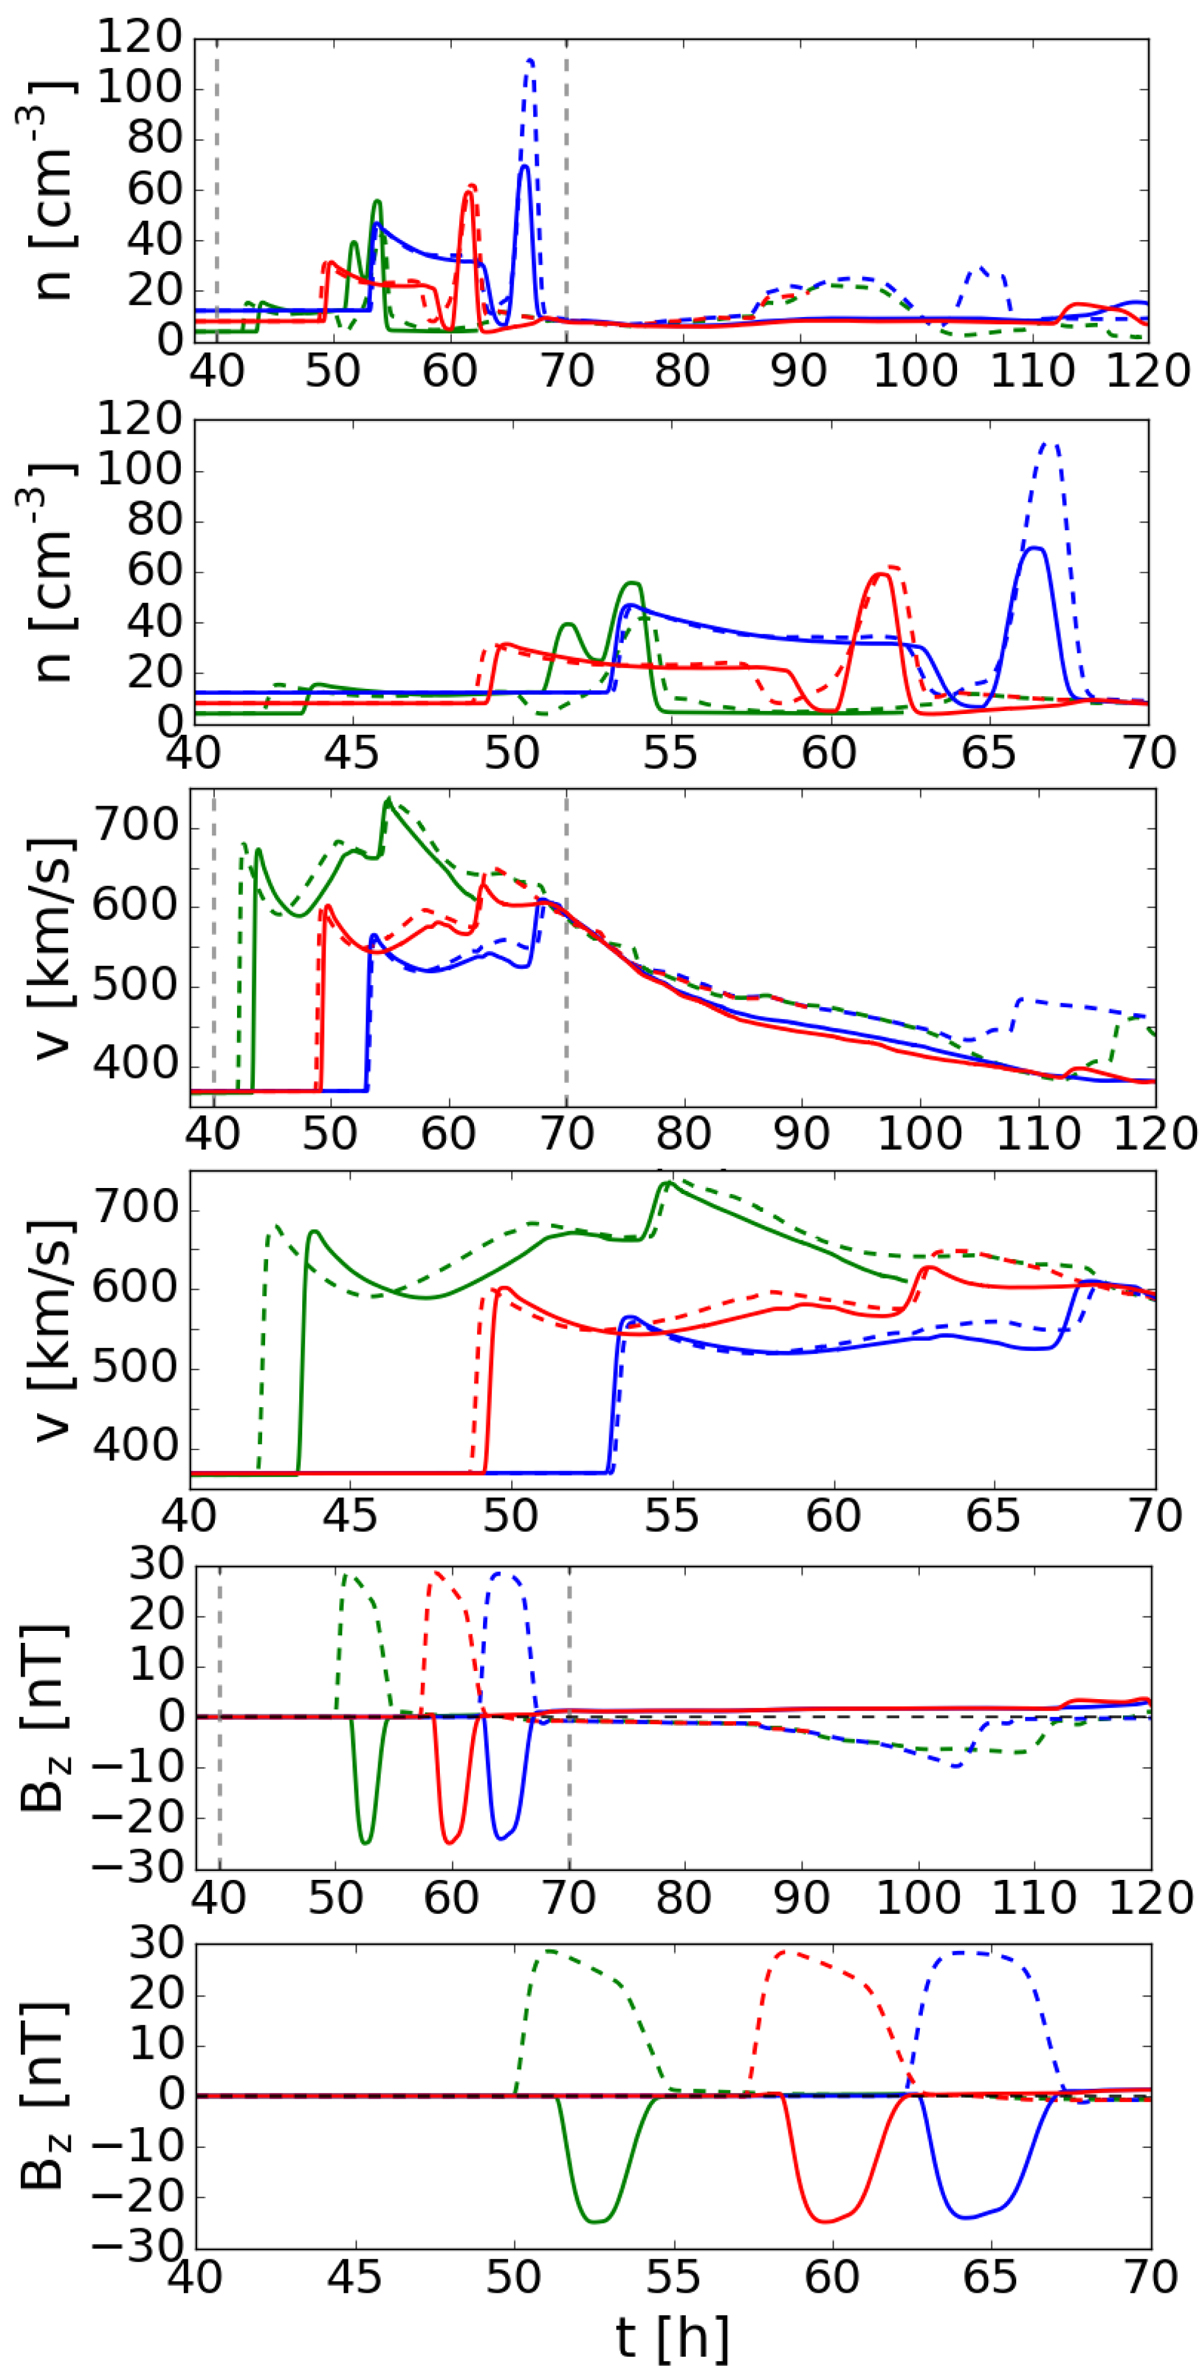
Synthetic satellite data at L1 for ICMEs ejected with an initial velocity of 800 km s−1 with varying polarities in different background winds. The green curves represent CMEs in low density background winds, the red curves medium density winds, and the blue curves high density winds. Normal CMEs are shown as solid lines while inverse CMEs are shown as dashed lines. The black dashed line in the two lowest plots represents Bz = 0. Each second plot is a zoom-in on the marked region between grey dashed lines in the plot above.
Current usage metrics show cumulative count of Article Views (full-text article views including HTML views, PDF and ePub downloads, according to the available data) and Abstracts Views on Vision4Press platform.
Data correspond to usage on the plateform after 2015. The current usage metrics is available 48-96 hours after online publication and is updated daily on week days.
Initial download of the metrics may take a while.