Fig. 12.
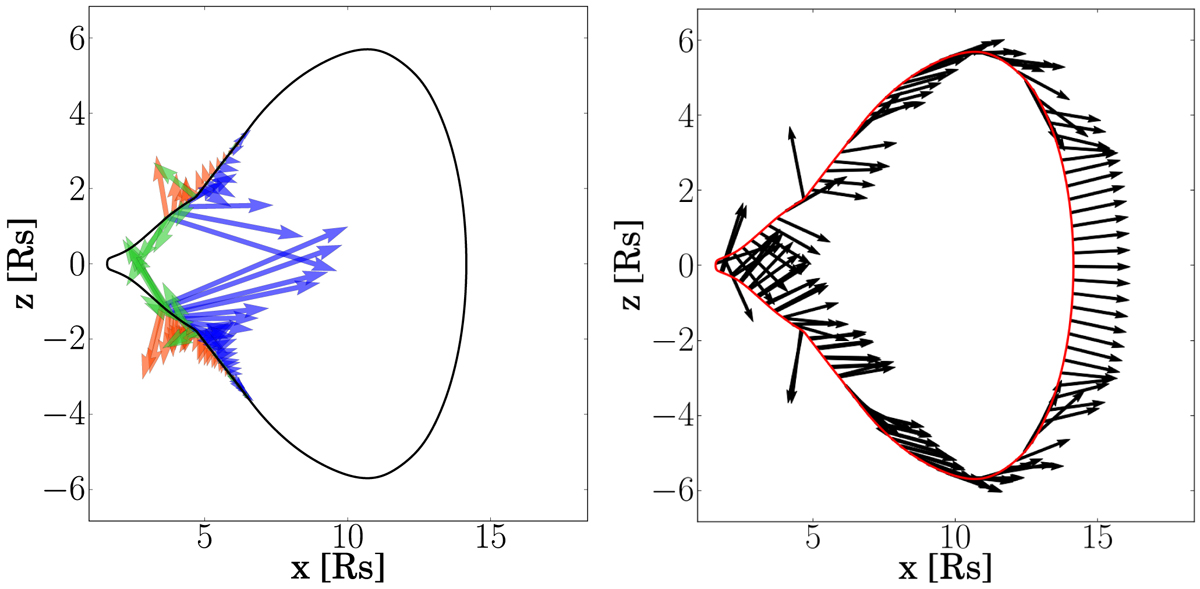
Left panel: separatrix at t = 3 h for a slow inverse CME in a low density background wind, with the arrows representing the forces that working on the separatrix. The green arrows represent the magnetic tension, red arrows the thermal pressure gradient, and blue arrows the magnetic pressure gradient. The vectors were not normalised, so only the vectors between x = [3.5, 10] were drawn since that is where the deformation cusps are located and otherwise the other force vectors would obscure the view. Right panel: total force vectors on the separatrix. Here, the vectors were normalised and drawn for the whole separatrix.
Current usage metrics show cumulative count of Article Views (full-text article views including HTML views, PDF and ePub downloads, according to the available data) and Abstracts Views on Vision4Press platform.
Data correspond to usage on the plateform after 2015. The current usage metrics is available 48-96 hours after online publication and is updated daily on week days.
Initial download of the metrics may take a while.