Fig. 9
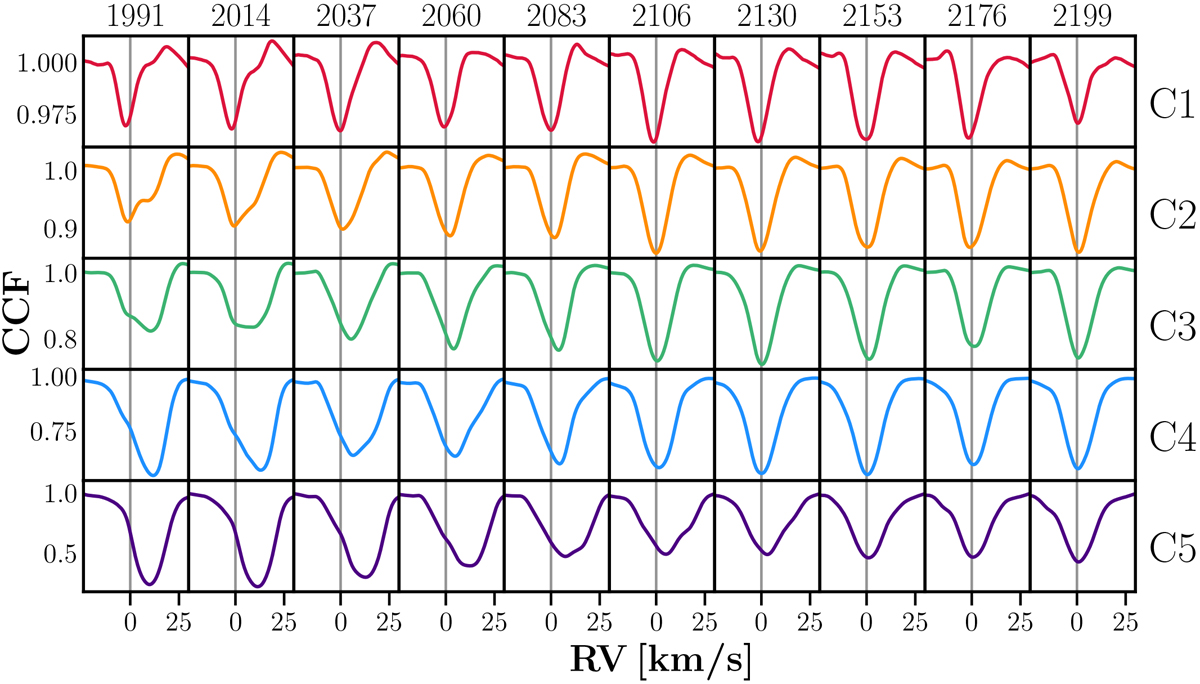
Excerpt of CCF sequence corresponding to time range between days 1990 and 2200 of 3D RHD simulation (see corresponding light curve in bottom panel of Fig. 10), for same masks as in Fig. 2. The day number corresponding to each snapshot is indicated on top of each subpanel. Vertical lines in all panels indicate the 0 km s−1 velocity (i.e., the CoM velocity of the 3D simulation).
Current usage metrics show cumulative count of Article Views (full-text article views including HTML views, PDF and ePub downloads, according to the available data) and Abstracts Views on Vision4Press platform.
Data correspond to usage on the plateform after 2015. The current usage metrics is available 48-96 hours after online publication and is updated daily on week days.
Initial download of the metrics may take a while.