Fig. 7
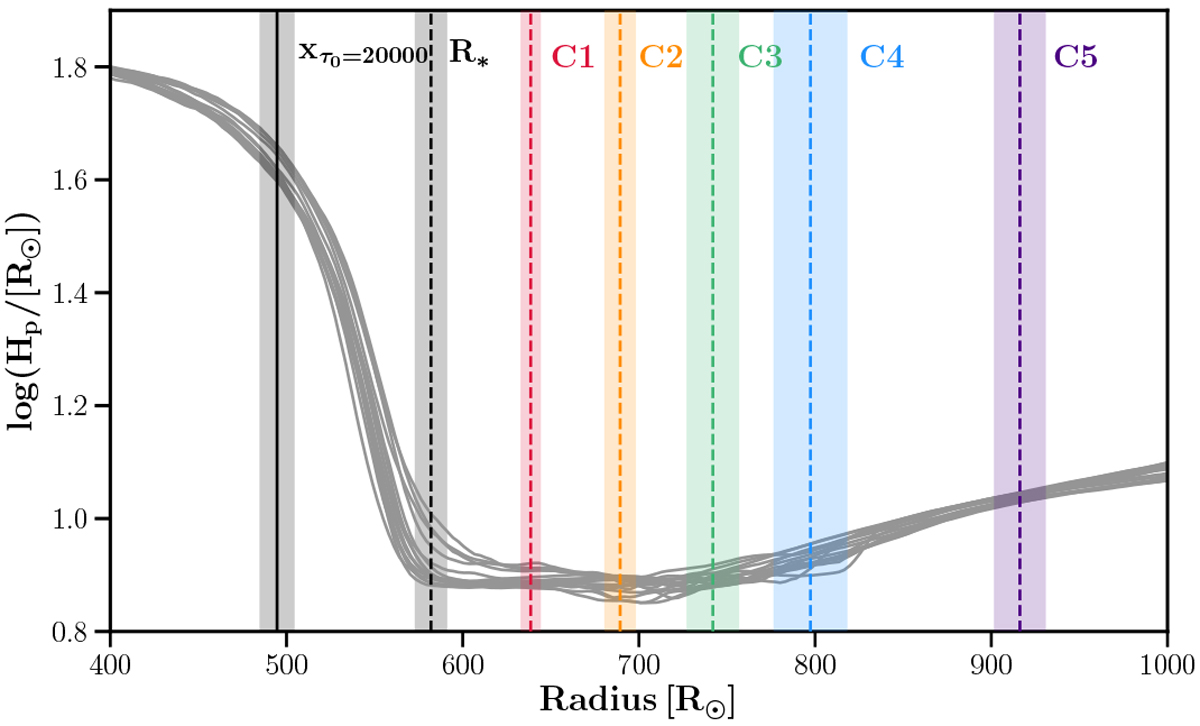
Pressure scale height (HP) profiles as function of shell radius for set of 3D snapshots. Vertical lines indicate the radial geometrical distances from the stellar center (averaged over a given snapshot and over time) corresponding to the tomographic masks C1–C5, along with the locations corresponding to τRoss = 1 (denoted as R*) and τ0 = 20 000. The bands are standard deviations of the averages over time.
Current usage metrics show cumulative count of Article Views (full-text article views including HTML views, PDF and ePub downloads, according to the available data) and Abstracts Views on Vision4Press platform.
Data correspond to usage on the plateform after 2015. The current usage metrics is available 48-96 hours after online publication and is updated daily on week days.
Initial download of the metrics may take a while.