Fig. 6
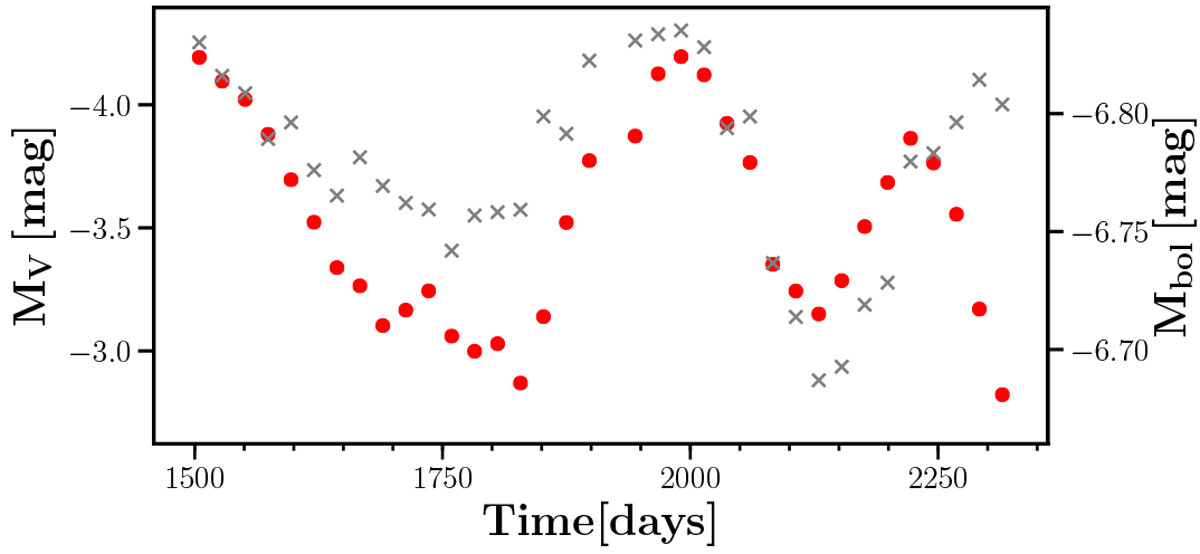
Absolute visual magnitude (red dots and left scale) and bolometric magnitude (black crosses and right scale) variations during restricted time span of 3D RHD simulation (gray-shaded area in Fig. 5). The absolute visual magnitude is computed by integrating 3D snapshot spectra in the V band (using the appropriate transmission curve).
Current usage metrics show cumulative count of Article Views (full-text article views including HTML views, PDF and ePub downloads, according to the available data) and Abstracts Views on Vision4Press platform.
Data correspond to usage on the plateform after 2015. The current usage metrics is available 48-96 hours after online publication and is updated daily on week days.
Initial download of the metrics may take a while.