Fig. 3
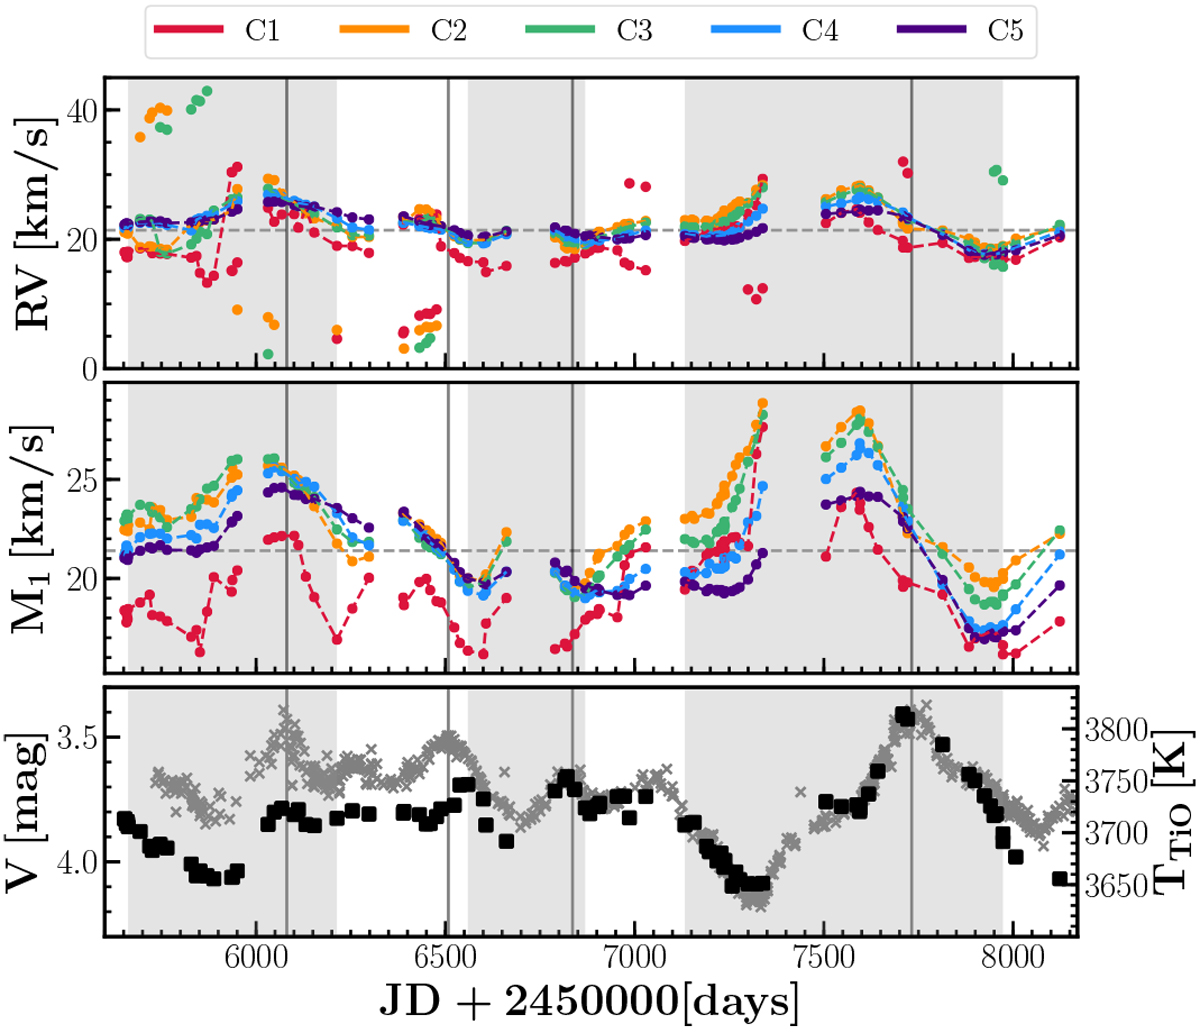
Top panel: RVs derived from fit of μ Cep CCFs with Gaussian functions. RVs from the main CCF component are connected. Only CCF components with depths ≤ 2σ, where σ is the standard deviation in the flat part of the CCFs (measuring the “correlation noise”), are kept. Colors correspond to different masks. Middle panel: M1 velocity of CCFs in all masks. The color coding is the same as in the top panel. Bottom panel: AAVSO visual light curve (gray crosses). Black squares correspond to TiO-band temperatures. Vertical lines in all panels indicate times of maximum light and reveal the phase shift between the light (or temperature) and RV variations, the light maximum occurs after the maximum velocity. Horizontal lines in top and middle panels indicate the mean RV. Gray areas define three pseudo light cycles, which correspond to the hysteresis loops in Fig. 4.
Current usage metrics show cumulative count of Article Views (full-text article views including HTML views, PDF and ePub downloads, according to the available data) and Abstracts Views on Vision4Press platform.
Data correspond to usage on the plateform after 2015. The current usage metrics is available 48-96 hours after online publication and is updated daily on week days.
Initial download of the metrics may take a while.