Fig. 2
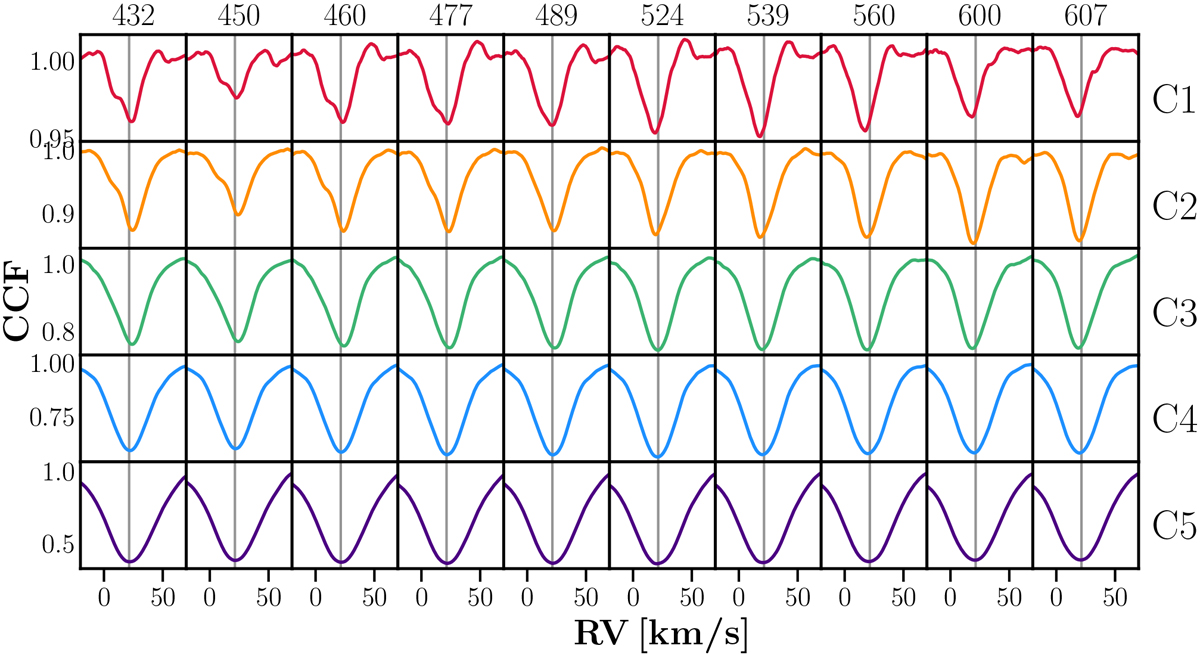
Excerpt of CCF sequence corresponding to time range between Julian date (JD) 2 456 432 and JD 2 456 607 (compared with light curve of μ Cep on bottom panel of Fig. 3). The last three JD digits are listed on the top of each subpanel. Colors correspond to different masks, mask C1 probes the innermost atmospheric layer while mask C5 probes the outermost layer. Vertical lines at 21.4 km s−1 indicate the mean radial velocity, computed from all masks and epochs (see text).
Current usage metrics show cumulative count of Article Views (full-text article views including HTML views, PDF and ePub downloads, according to the available data) and Abstracts Views on Vision4Press platform.
Data correspond to usage on the plateform after 2015. The current usage metrics is available 48-96 hours after online publication and is updated daily on week days.
Initial download of the metrics may take a while.