Fig. 13
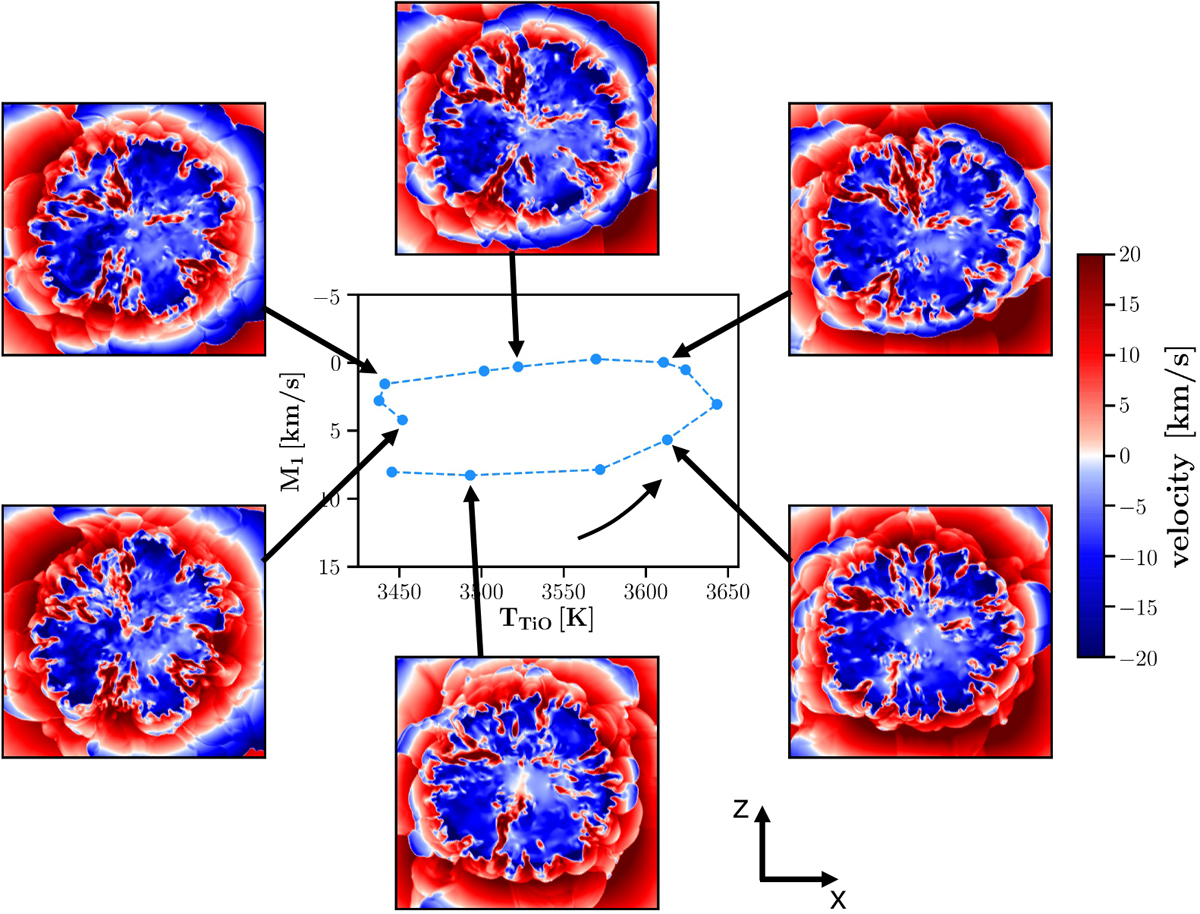
Velocity maps computed along rays from center of star in an equatorial plane for snapshots along hysteresis loop of mask C4 (online version of paper displays animated version of this figure). This figure displays the large-scale structure of the convection, from the stellar center to the stellar surface. Moreover, it illustrates the appearance of shocks at the stellar surface and their propagation through the atmosphere.
Current usage metrics show cumulative count of Article Views (full-text article views including HTML views, PDF and ePub downloads, according to the available data) and Abstracts Views on Vision4Press platform.
Data correspond to usage on the plateform after 2015. The current usage metrics is available 48-96 hours after online publication and is updated daily on week days.
Initial download of the metrics may take a while.