Fig. 12
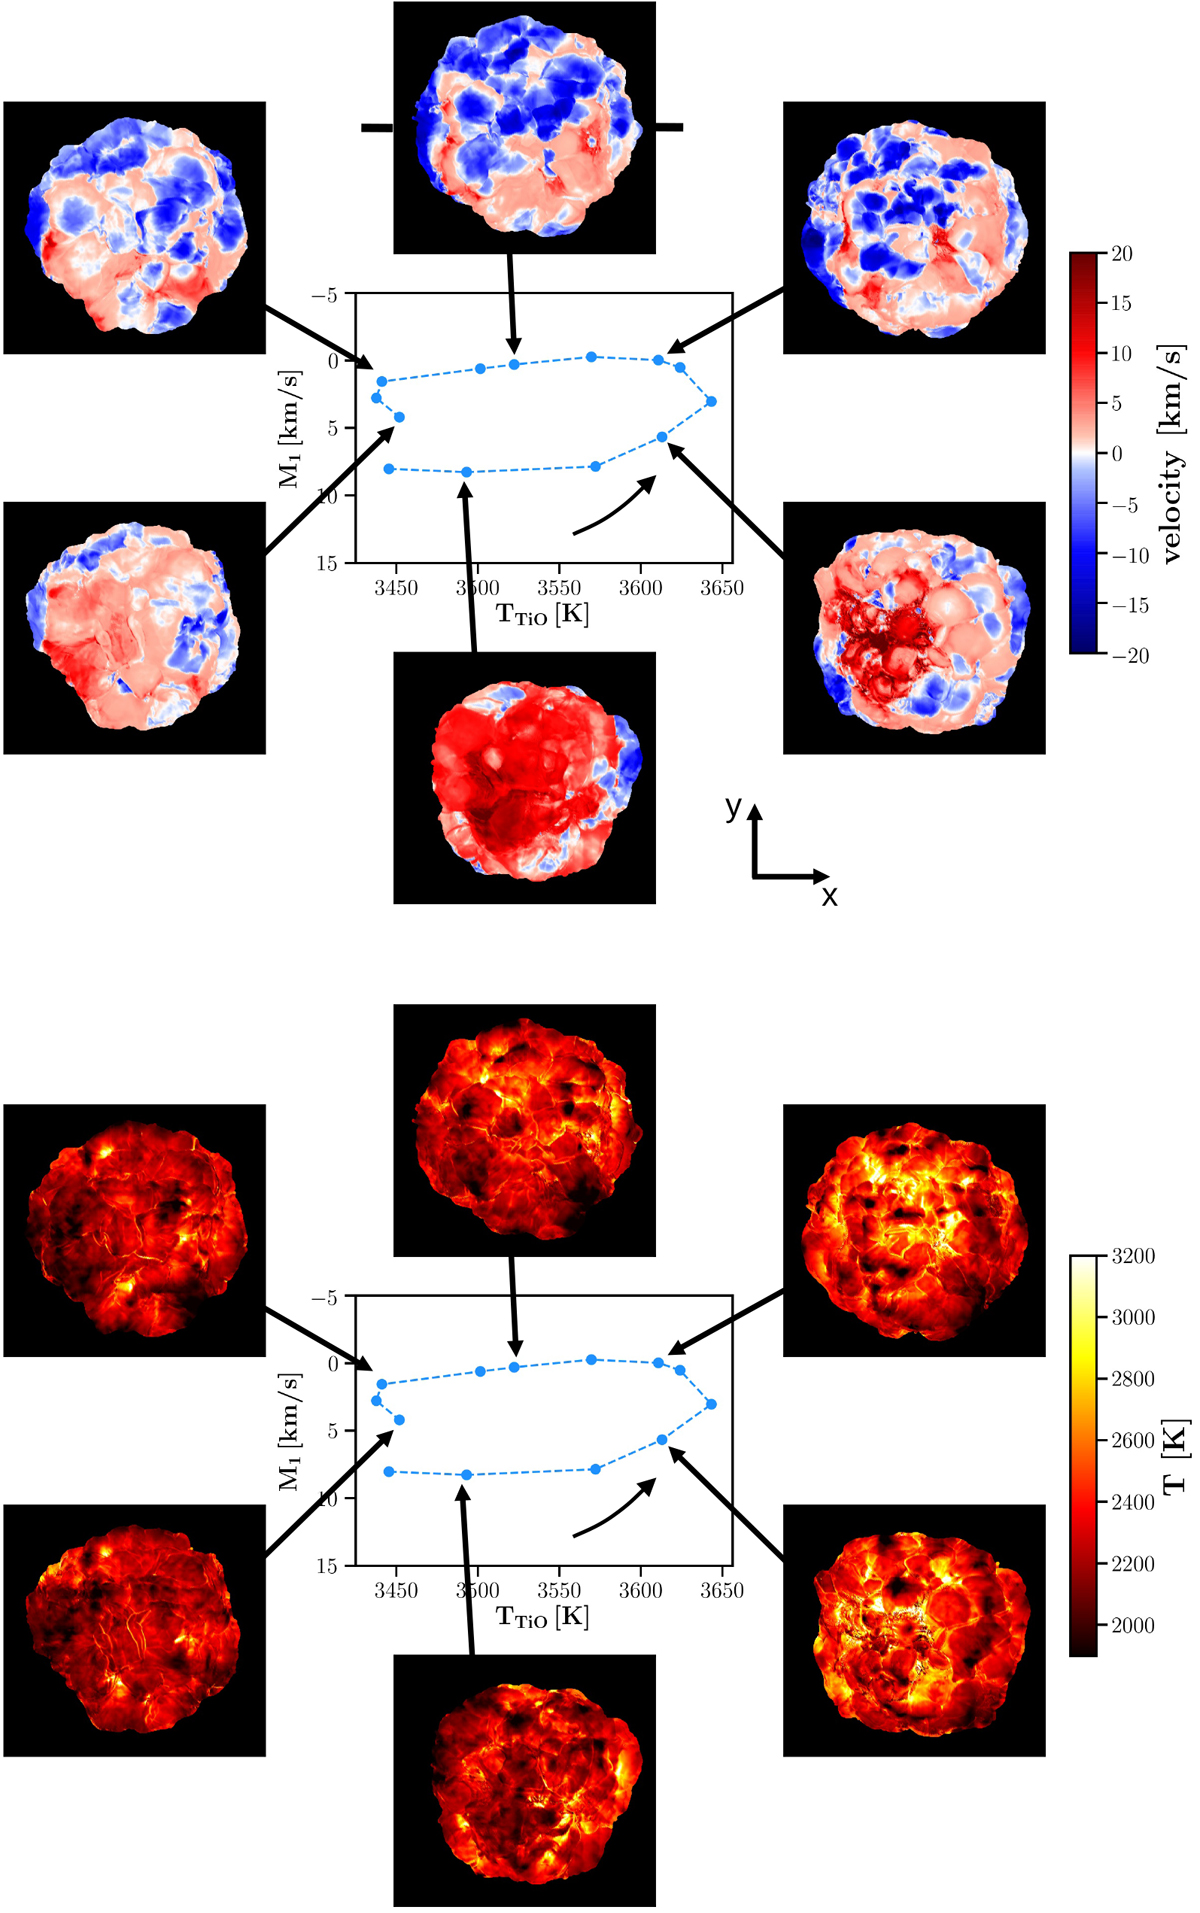
Top panel: line-of-sight velocity maps (for observer located in front of figure) weighted by CF for snapshots along hysteresis loop of mask C4. Red color corresponds to falling material, and blue color to rising material. Bottom panel: same as top panel for temperature. The arrow indicates the direction of the evolution along the hysteresis loop. The horizontal ticks on the top velocity map show the location of the equatorial plane of 3D snapshots displayed in Fig. 13.
Current usage metrics show cumulative count of Article Views (full-text article views including HTML views, PDF and ePub downloads, according to the available data) and Abstracts Views on Vision4Press platform.
Data correspond to usage on the plateform after 2015. The current usage metrics is available 48-96 hours after online publication and is updated daily on week days.
Initial download of the metrics may take a while.