Fig. 11
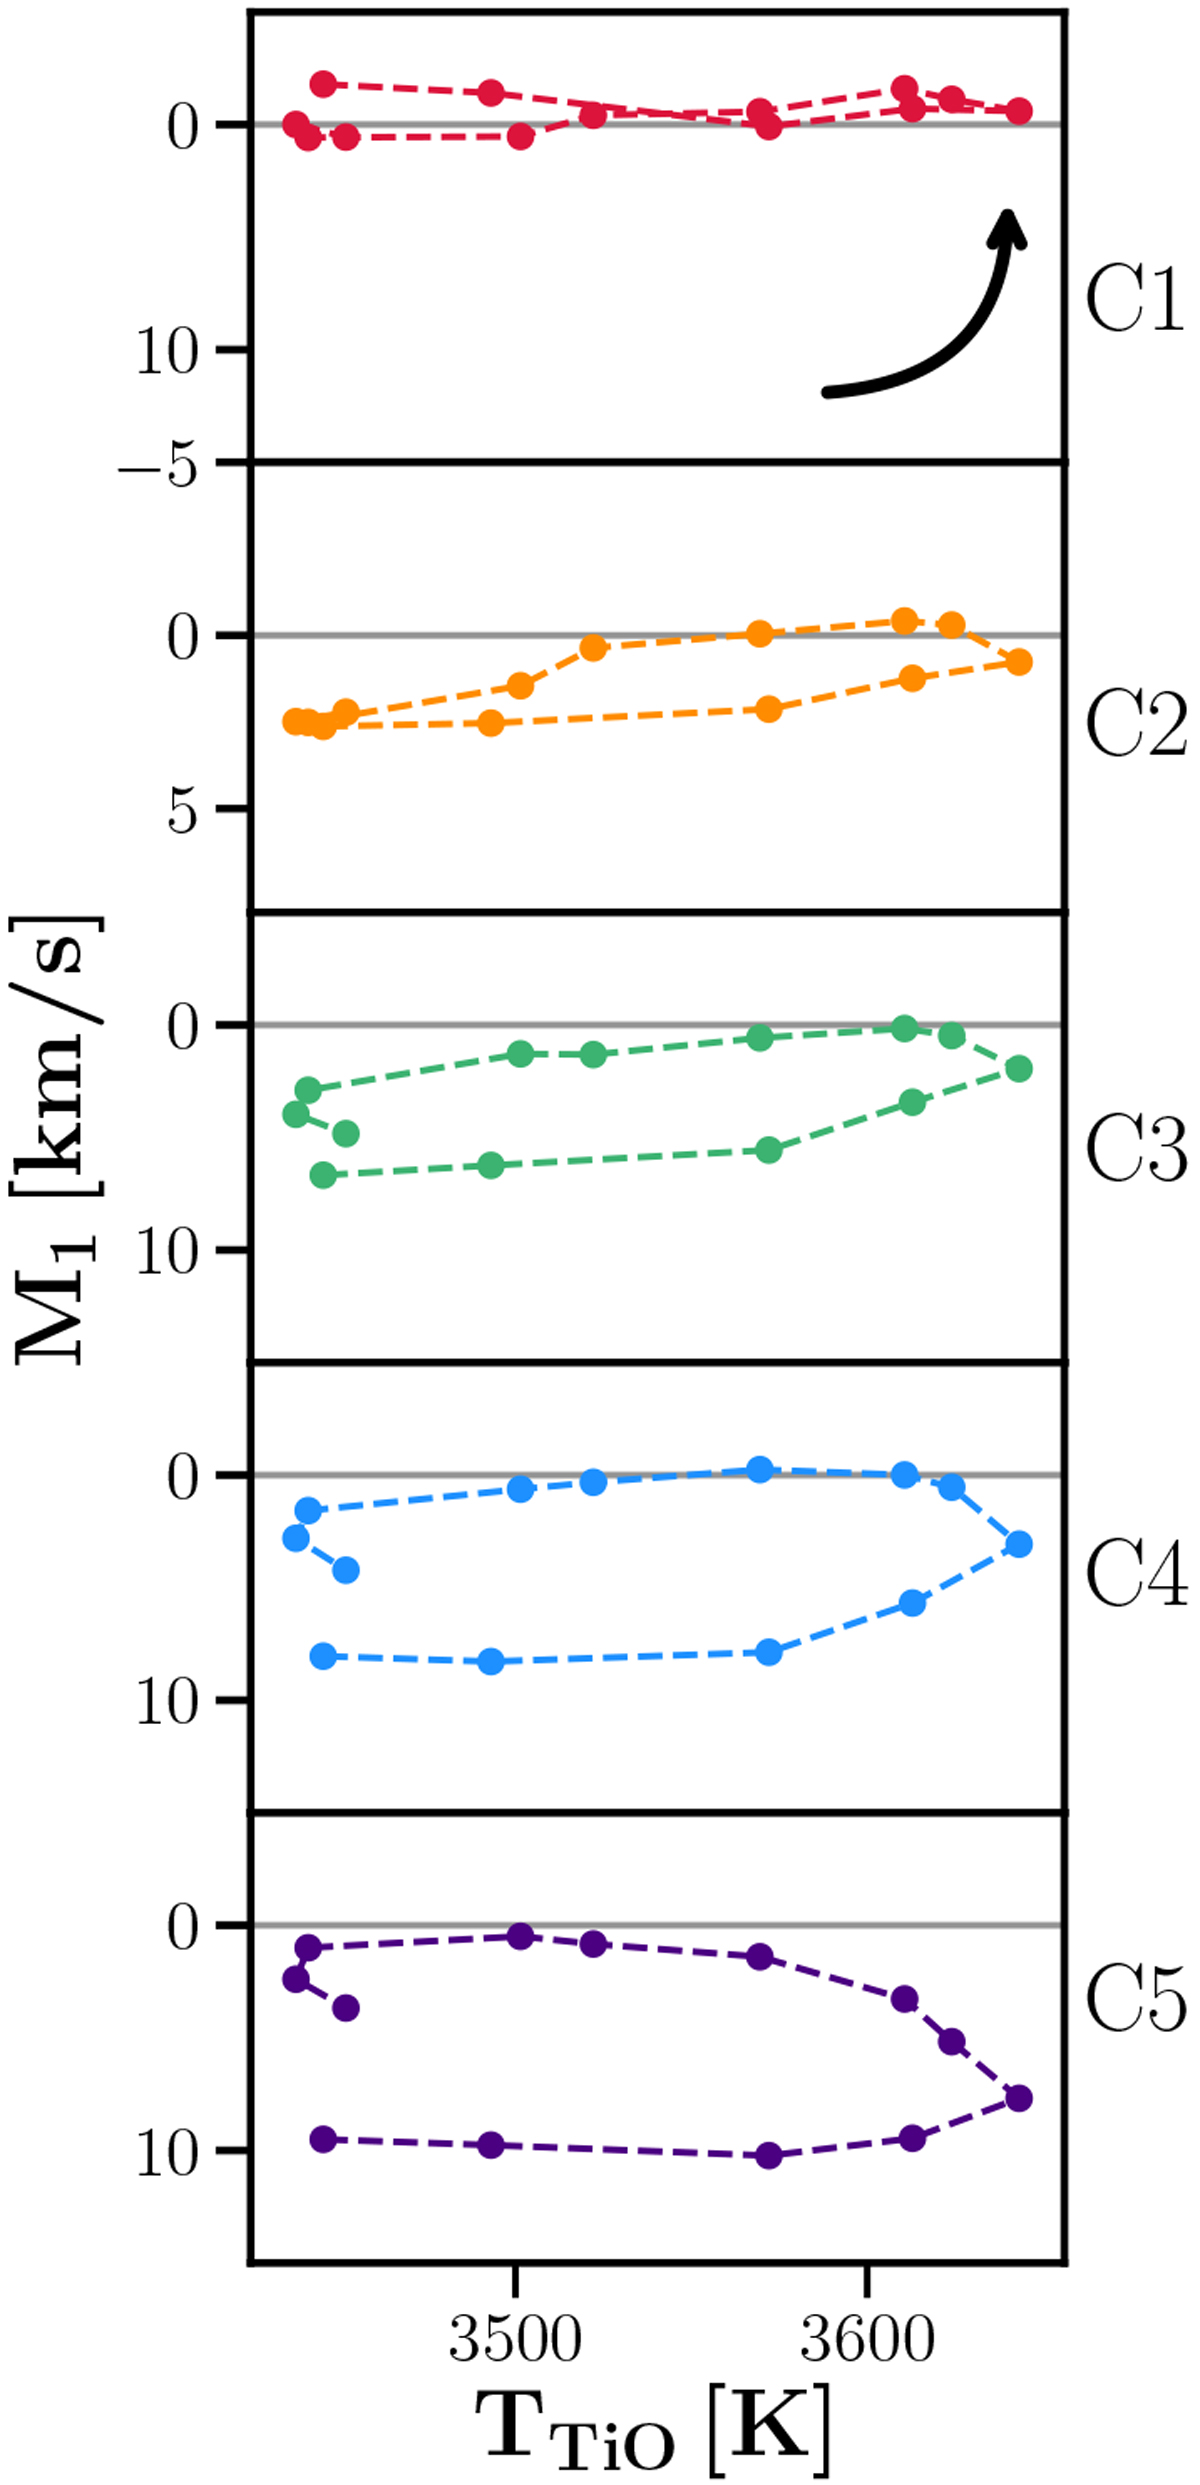
Hysteresis loop between TiO-band temperature and M1 velocity for snapshots from 3D simulation. Colors correspond to different masks, with mask C1 probing the innermost atmospheric layer, and mask C5 the outermost. Horizontal lines in all panels indicate the CoM velocity of the 3D simulation, that is, 0 km s−1. The arrow indicates the direction of the evolution along the hysteresis loop.
Current usage metrics show cumulative count of Article Views (full-text article views including HTML views, PDF and ePub downloads, according to the available data) and Abstracts Views on Vision4Press platform.
Data correspond to usage on the plateform after 2015. The current usage metrics is available 48-96 hours after online publication and is updated daily on week days.
Initial download of the metrics may take a while.