Fig. 9.
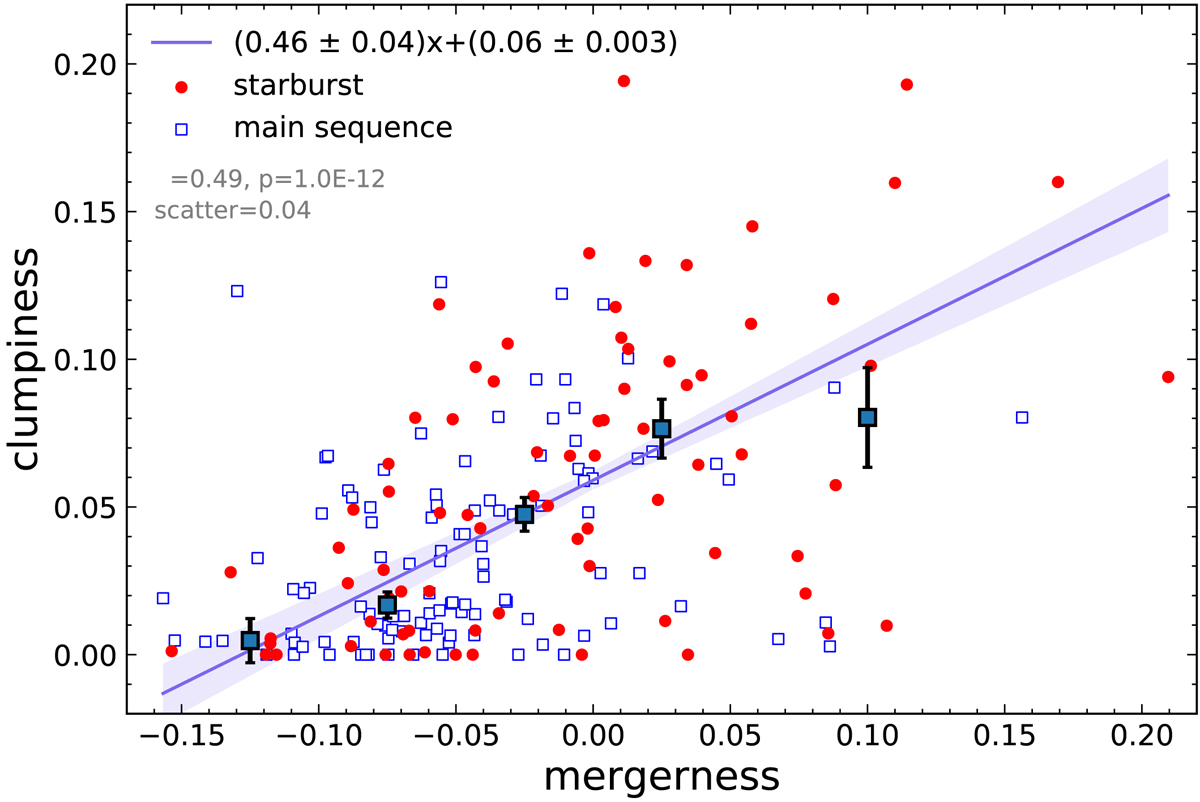
Comparison between the clumpiness and the mergerness parameters for our sample of SB and MS galaxies (with red filled circles and blue empty squares, respectively). The clumpiness medians with corresponding errors are computed for the whole sample and shown in five different bins of mergerness with square symbols and vertical black bars. The best-fit linear correlation and 1σ error are indicated by the violet line and violet shaded area. In the upper-left part of the plot we include the equation of the best-fit line, the Pearson correlation coefficient ρ, the p-value and the 1σ scatter of the relation.
Current usage metrics show cumulative count of Article Views (full-text article views including HTML views, PDF and ePub downloads, according to the available data) and Abstracts Views on Vision4Press platform.
Data correspond to usage on the plateform after 2015. The current usage metrics is available 48-96 hours after online publication and is updated daily on week days.
Initial download of the metrics may take a while.