Open Access
Fig. A.3.
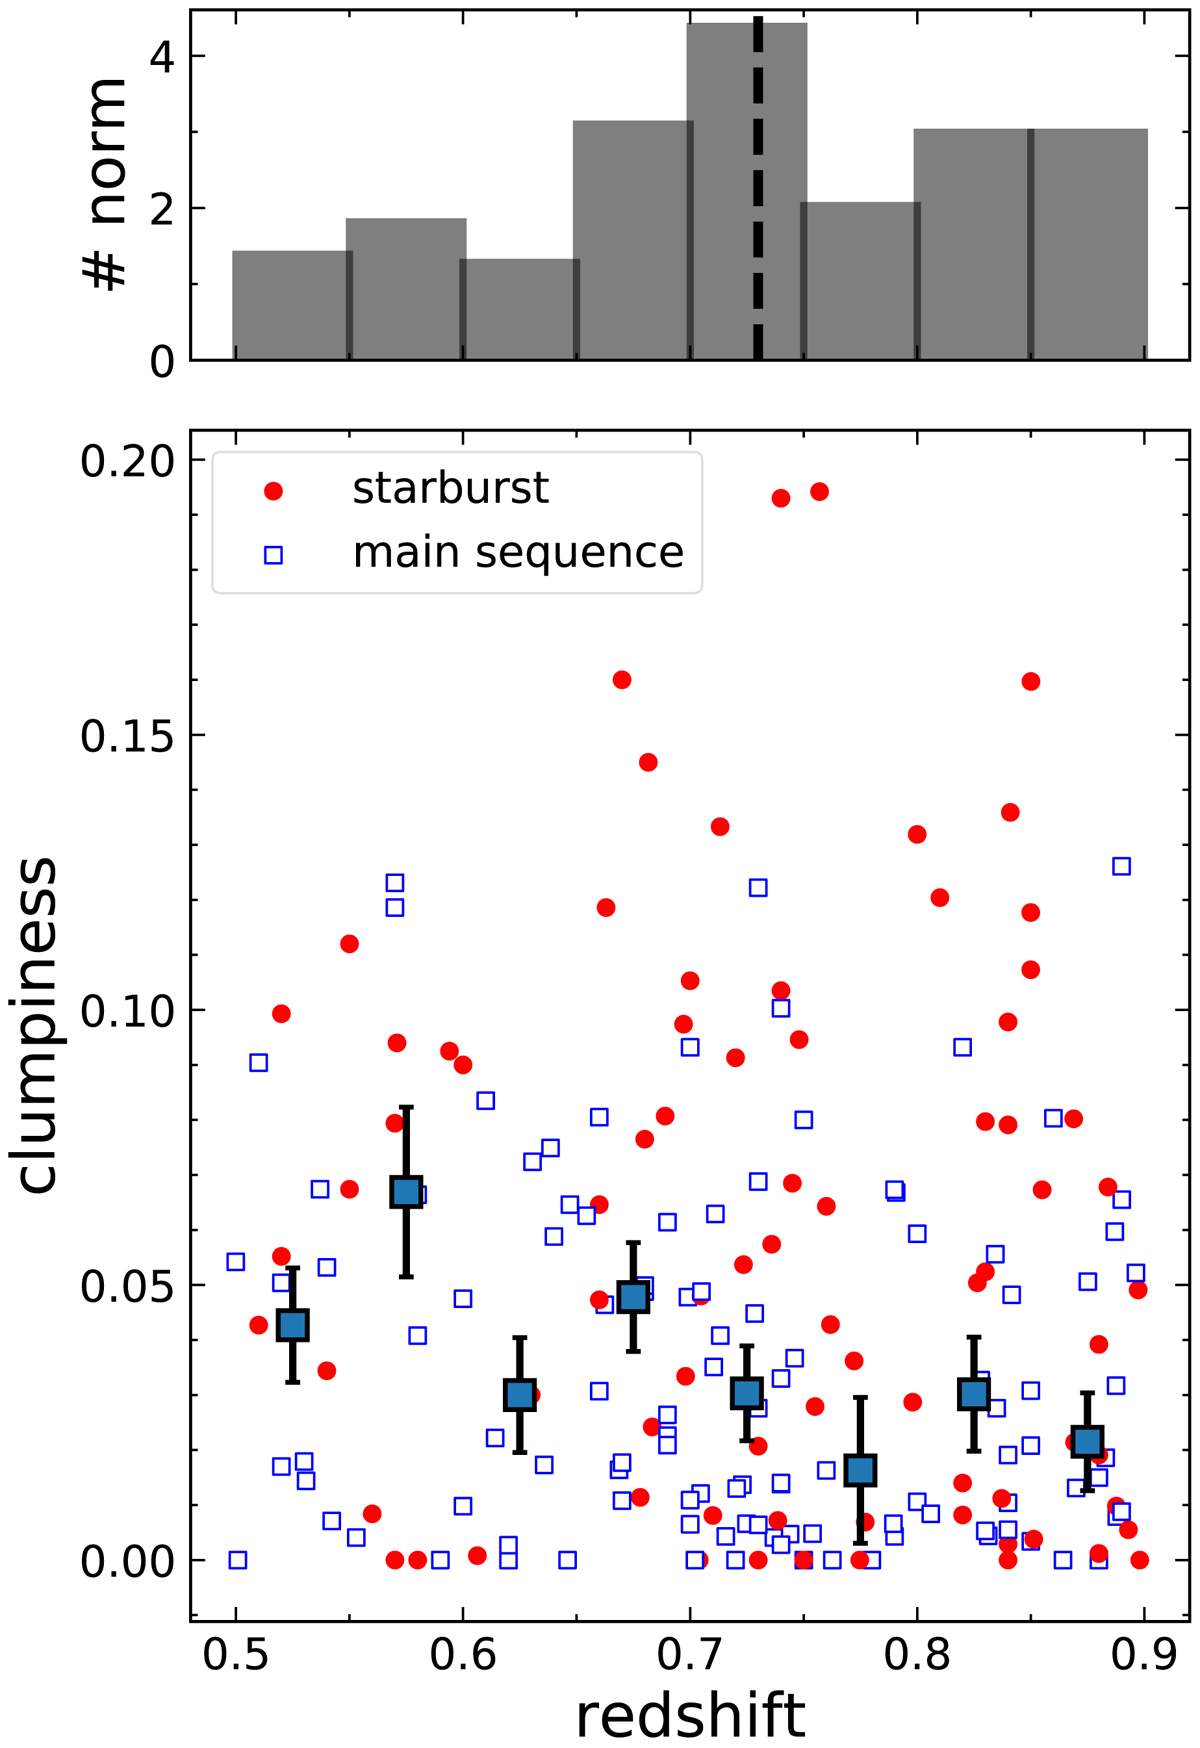
Redshift vs clumpiness for our final selected galaxies, with gray squares and black error bars representing the median clumpiness and error calculated inside eight redshift bins. Top: redshift histogram distribution of our galaxies, with the median redshift (zmed = 0.73) highlighted with a black dashed line.
Current usage metrics show cumulative count of Article Views (full-text article views including HTML views, PDF and ePub downloads, according to the available data) and Abstracts Views on Vision4Press platform.
Data correspond to usage on the plateform after 2015. The current usage metrics is available 48-96 hours after online publication and is updated daily on week days.
Initial download of the metrics may take a while.