Fig. B.5.
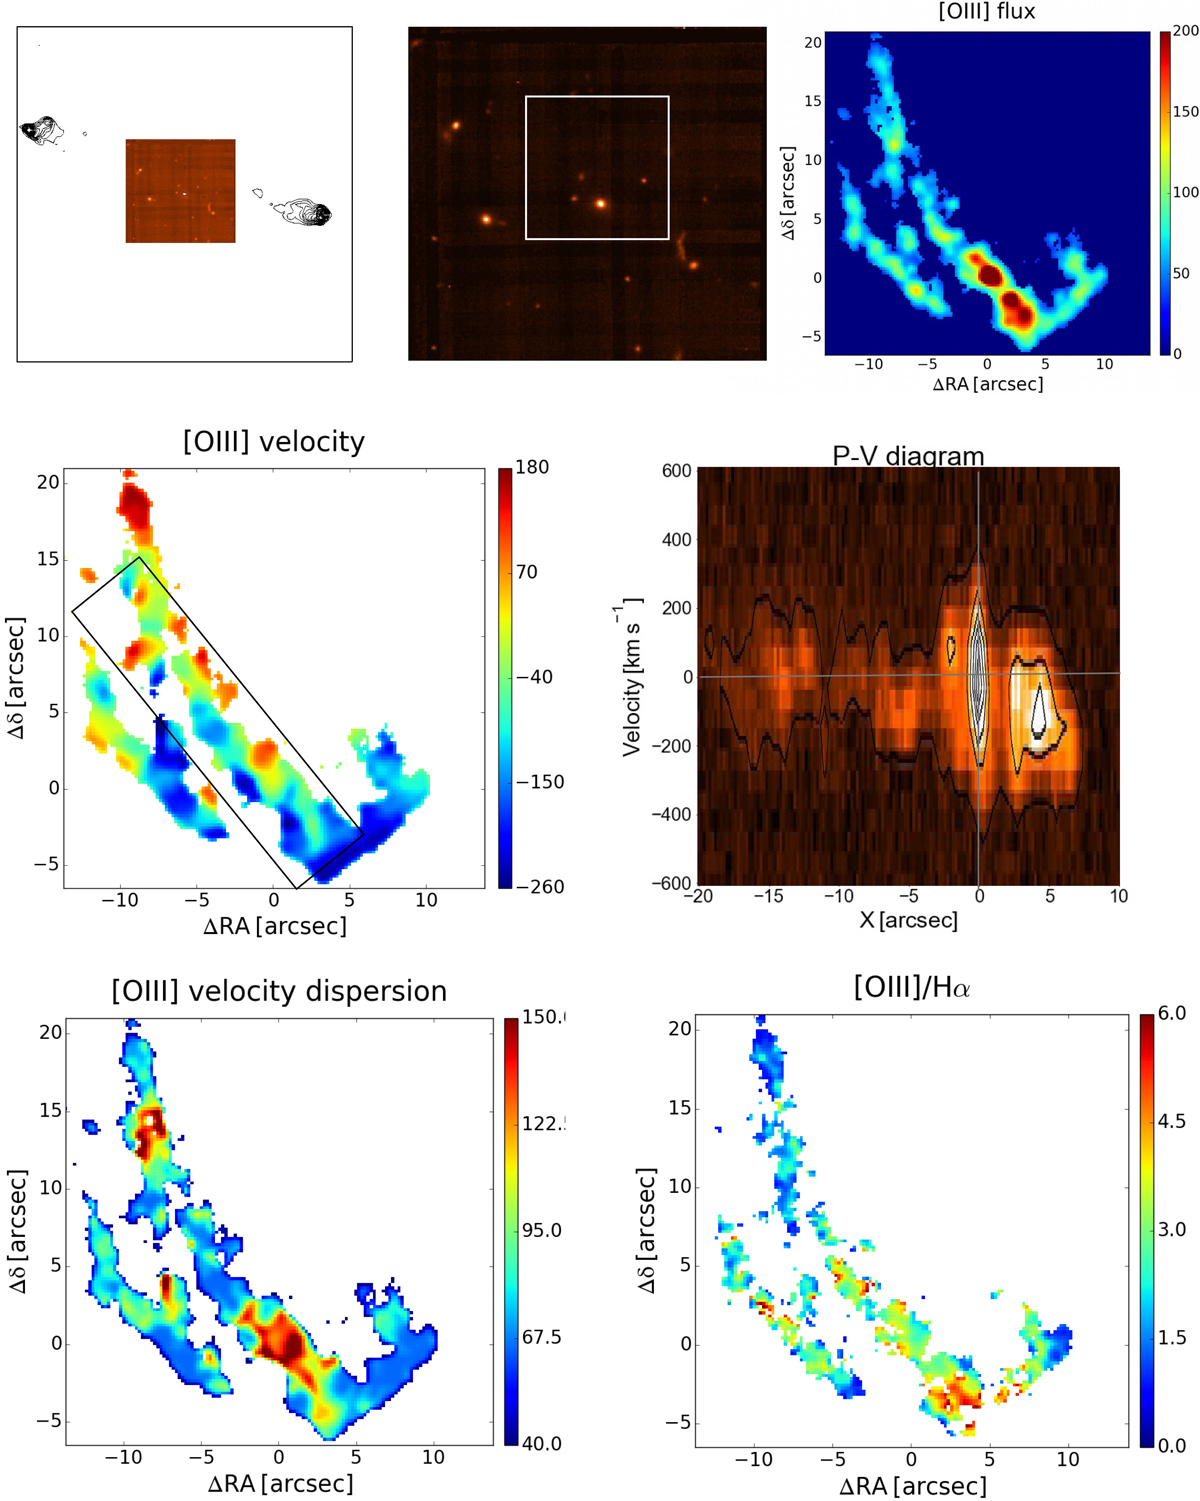
3C 403.1, FR II/LEG, 1″ = 1.07 kpc. Top left: radio contours overlaid onto the Muse optical continuum image. Top center: Muse optical continuum image. Top right: Hα emission line image extracted from the white square in the top center panel. Middle: velocity field from the Hα line and PV diagram (the synthetic slit is centered on the nucleus, has a width of 5 pixels and it is oriented at an angle of 60° from the X axis). Bottom: Hα velocity dispersion and [O III]/Hα ratio.
Current usage metrics show cumulative count of Article Views (full-text article views including HTML views, PDF and ePub downloads, according to the available data) and Abstracts Views on Vision4Press platform.
Data correspond to usage on the plateform after 2015. The current usage metrics is available 48-96 hours after online publication and is updated daily on week days.
Initial download of the metrics may take a while.