Fig. 1.
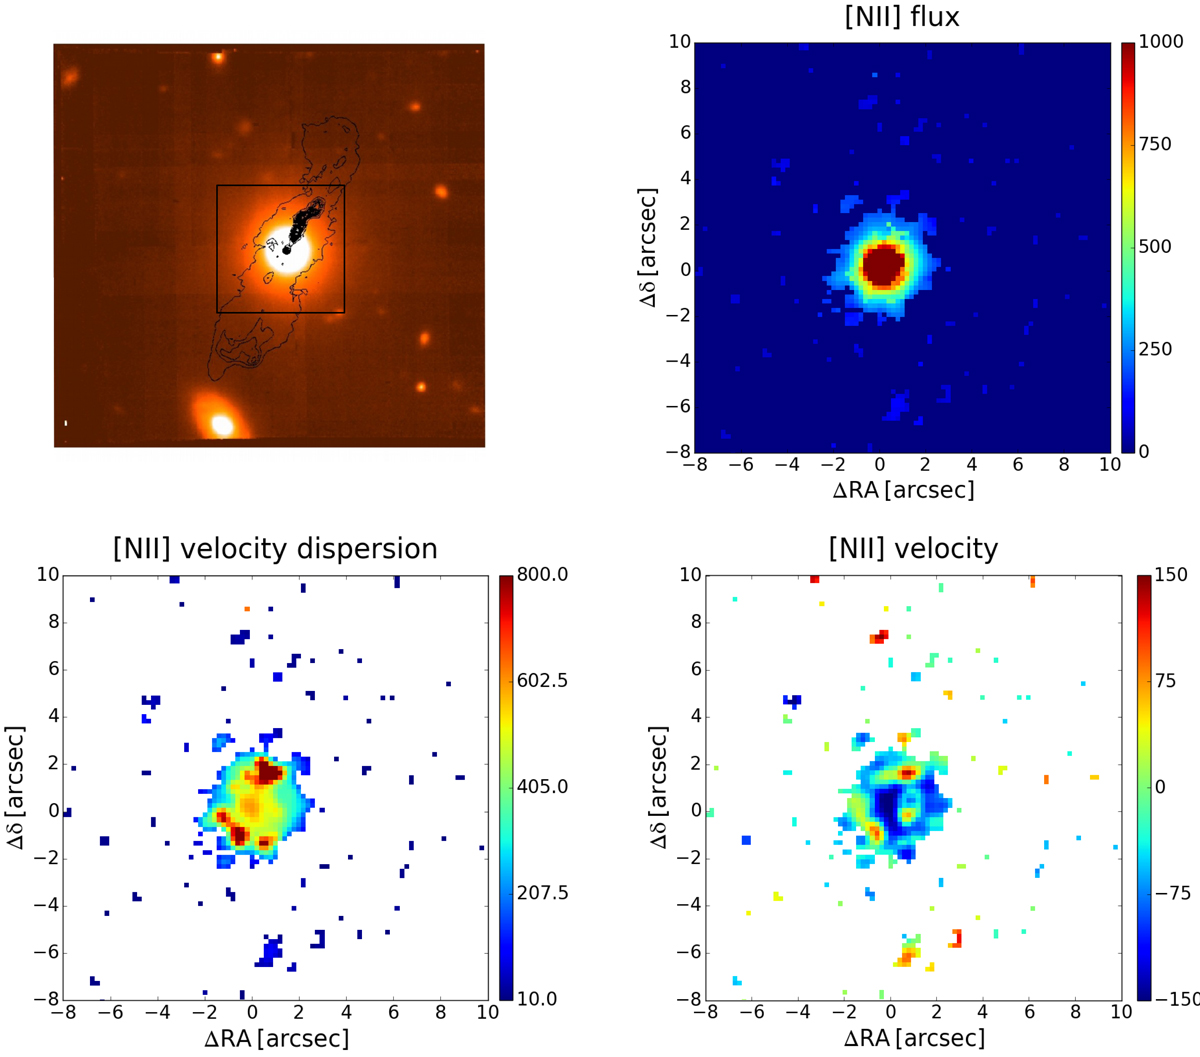
3C 015, FR I/LEG, 1″ = 1.40 kpc. Top left: radio contours (black) overlaid onto the Muse optical continuum image in the 5800 and 6250 Å rest frame range. The size of the image is the whole MUSE field of view, 1′ × 1′. Top right: [N II] emission line image extracted from the black square marked in the left panel. Surface brightness is in 10−18 erg s−1 cm−2 arcsec−2. Bottom: velocity field and velocity dispersion for the [N II] line. Velocities are in km s−1 units.
Current usage metrics show cumulative count of Article Views (full-text article views including HTML views, PDF and ePub downloads, according to the available data) and Abstracts Views on Vision4Press platform.
Data correspond to usage on the plateform after 2015. The current usage metrics is available 48-96 hours after online publication and is updated daily on week days.
Initial download of the metrics may take a while.