Fig. 9.
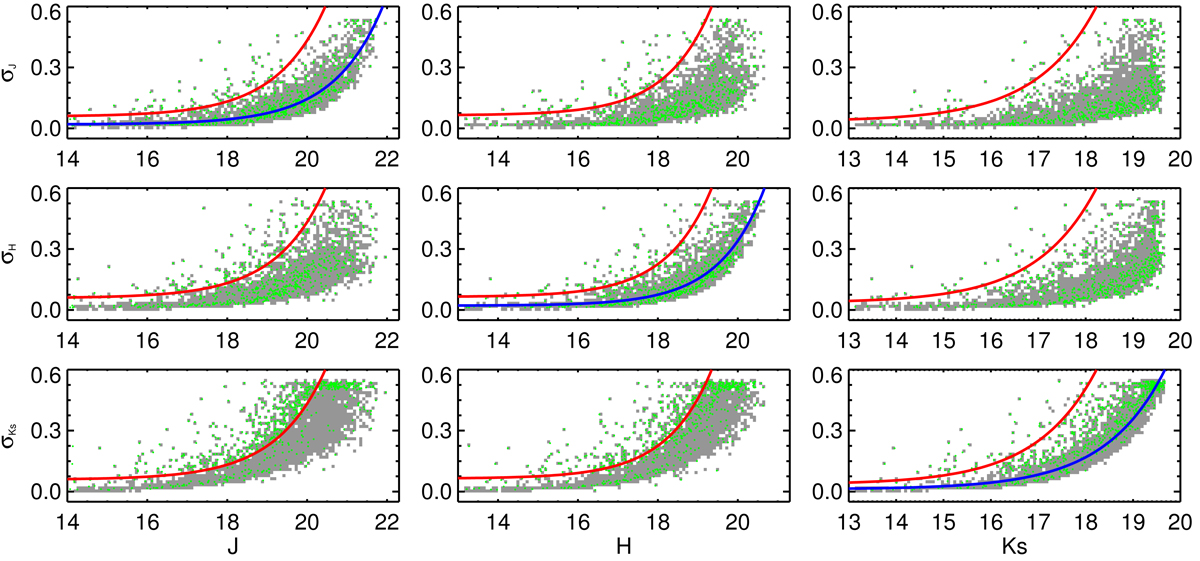
Relations between photometric uncertainties and magnitudes for sources in a partial region of “d003” (∼3′ × 3′ central region of tile “d003”). The gray dots represent all detected sources. The flagged spurious detections are marked with green dots. The blue curves show the exponential fittings for all the sources while the red curves mark the corresponding thresholds of photometric uncertainties that are used to flag the possible spurious detections.
Current usage metrics show cumulative count of Article Views (full-text article views including HTML views, PDF and ePub downloads, according to the available data) and Abstracts Views on Vision4Press platform.
Data correspond to usage on the plateform after 2015. The current usage metrics is available 48-96 hours after online publication and is updated daily on week days.
Initial download of the metrics may take a while.