Open Access
Fig. 7.
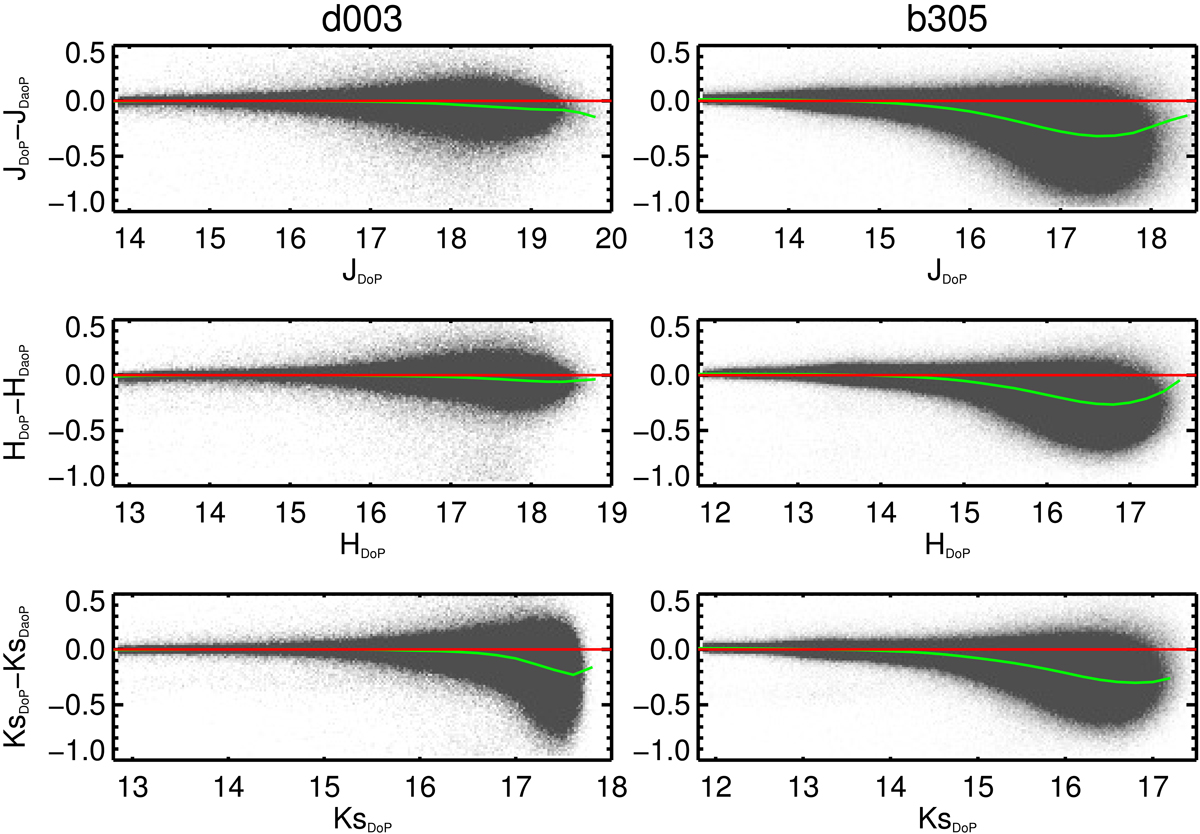
Released DoPHOT photometry vs. our DaoPHOT photometry in tiles “d003” (left panels) and “b305” (right panels). The backgrounds are source number density maps. The green curves show moving medians with a box width of 0.2 mag while the red lines mark the zero difference value.
Current usage metrics show cumulative count of Article Views (full-text article views including HTML views, PDF and ePub downloads, according to the available data) and Abstracts Views on Vision4Press platform.
Data correspond to usage on the plateform after 2015. The current usage metrics is available 48-96 hours after online publication and is updated daily on week days.
Initial download of the metrics may take a while.