Fig. 19.
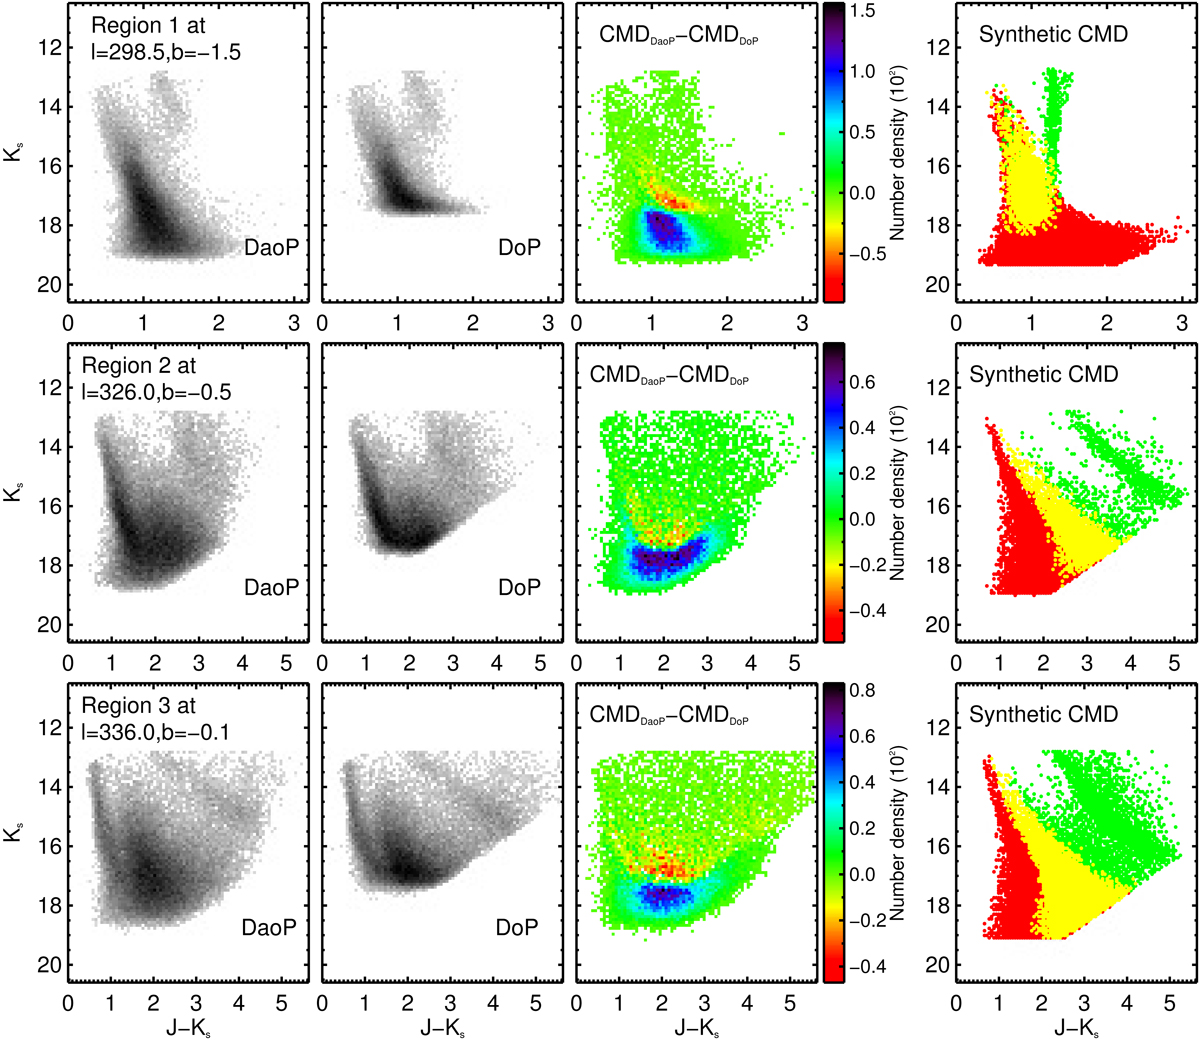
J − Ks vs. Ks CMDs of three ∼10′ × 10′ test fields that are located in the Galactic disk area. The upper, middle, and bottom panels represent regions 1, 2, and 3, respectively. The center of each field is also marked in the corresponding panel. Left panels: CMDs constructed with all DaoPHOT sources; middle left panels: CMDs constructed with all DoPHOT sources; middle right panels: differential CMDs obtained by subtracting the number density CMD map constructed with DoPHOT catalog from that built with DaoPHOT catalog; right panels: the synthetic CMDs built with the Besançon Galactic model (Robin et al. 2003). The MS stars, giants, and subgiants in the Galactic disk are labeled with red, green, and yellow dots, respectively.
Current usage metrics show cumulative count of Article Views (full-text article views including HTML views, PDF and ePub downloads, according to the available data) and Abstracts Views on Vision4Press platform.
Data correspond to usage on the plateform after 2015. The current usage metrics is available 48-96 hours after online publication and is updated daily on week days.
Initial download of the metrics may take a while.