Fig. 1.
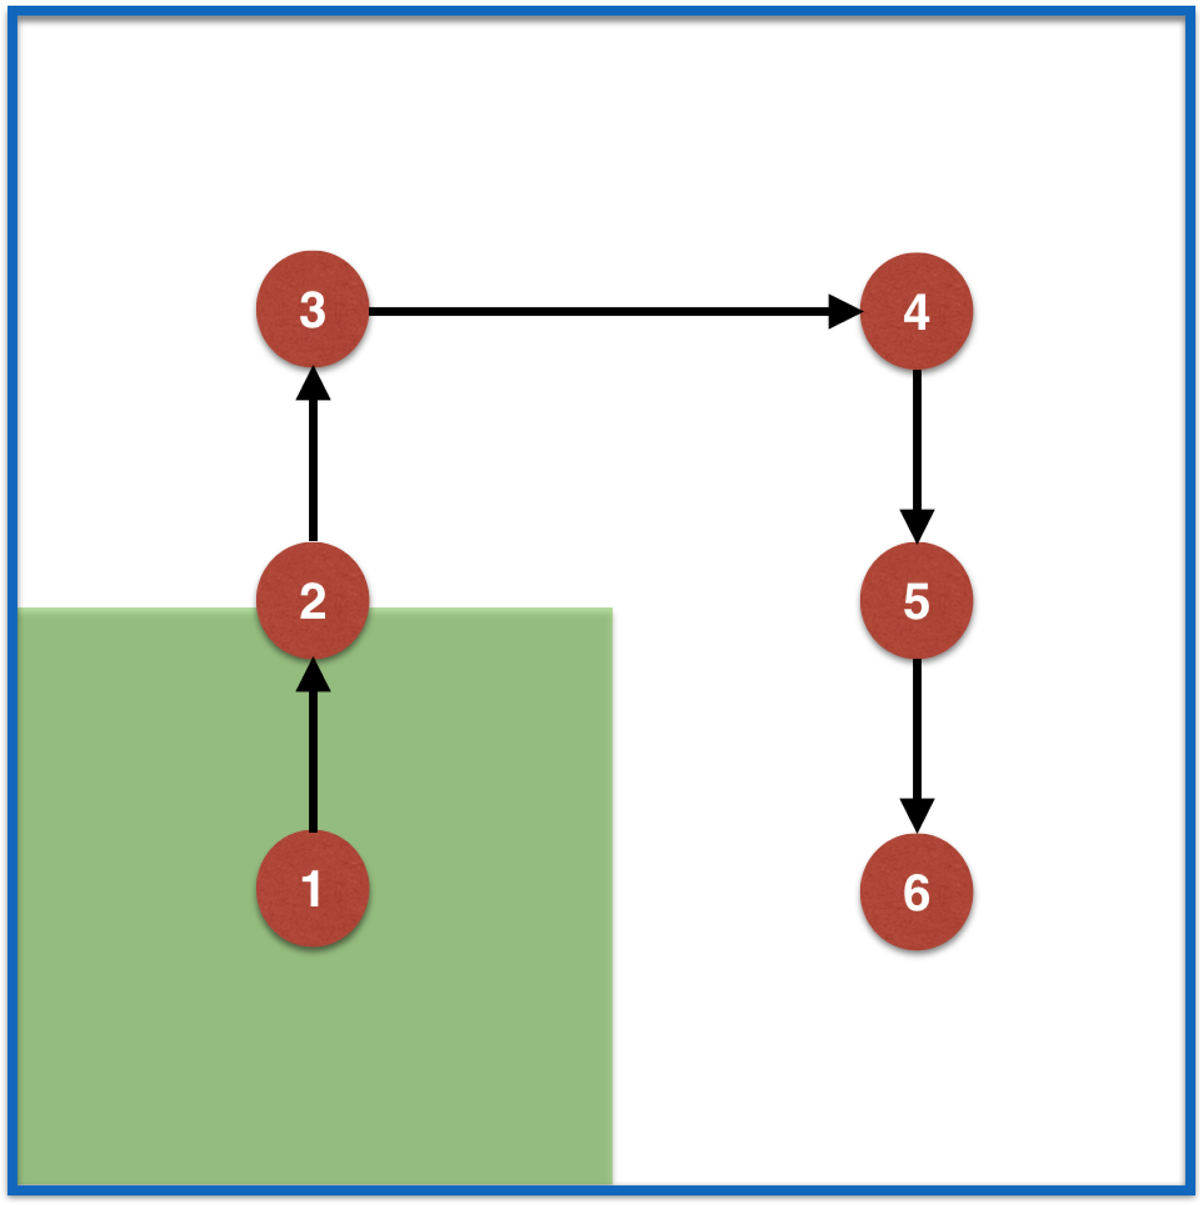
Sketch of “Tile6n” observing pattern for one VISTA detector. The six dithering pointings are labeled with the red filled circles. The numerals marked on red circles and the arrows show the dithering sequence. The filled green box represents the field of view of a detector and the solid blue square marks the total area covered by six dithering images.
Current usage metrics show cumulative count of Article Views (full-text article views including HTML views, PDF and ePub downloads, according to the available data) and Abstracts Views on Vision4Press platform.
Data correspond to usage on the plateform after 2015. The current usage metrics is available 48-96 hours after online publication and is updated daily on week days.
Initial download of the metrics may take a while.