Fig. 9
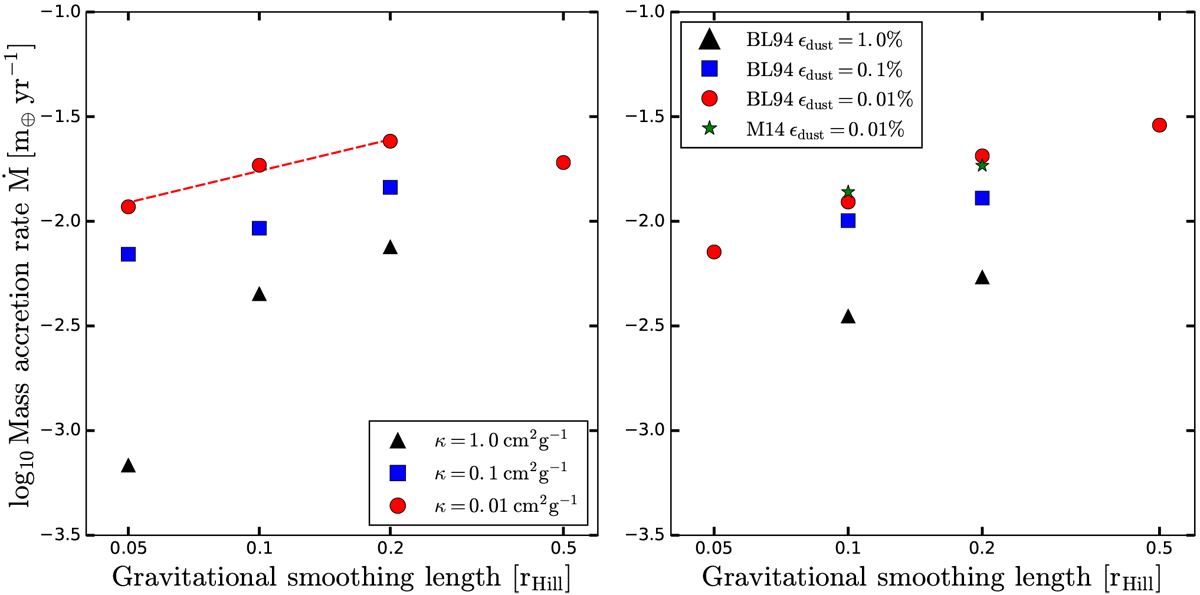
Dependency of the accretion rates on the smoothing length and opacities for simulations with the highest available resolution as depicted in Fig. 8. Left: averaged accretion rates from 5 to 15 orbits, for
![]() down to
down to ![]() and our three different opacity values. Simulation runs with
and our three different opacity values. Simulation runs with ![]() have such a shallow potential that the horseshoe flows, which penetrate down to approximately
have such a shallow potential that the horseshoe flows, which penetrate down to approximately
![]() also interfere with the envelope cooling process. Right: accretion rates with Bell and Lin opacities, with 1 (=solar), 0.1, and 0.01% dust opacities, as well as a run with Malygin opacities and
ɛ=0.01%. Simulation runs with
also interfere with the envelope cooling process. Right: accretion rates with Bell and Lin opacities, with 1 (=solar), 0.1, and 0.01% dust opacities, as well as a run with Malygin opacities and
ɛ=0.01%. Simulation runs with ![]() have been shown in Fig. 8 to be sufficiently resolved. We therefore interpret the seen downwards trend of
Ṁ with
have been shown in Fig. 8 to be sufficiently resolved. We therefore interpret the seen downwards trend of
Ṁ with ![]() as real (red dashed line), even if runs with
as real (red dashed line), even if runs with ![]() are only at the verge of fulfilling our convergence criterion.
are only at the verge of fulfilling our convergence criterion.
Current usage metrics show cumulative count of Article Views (full-text article views including HTML views, PDF and ePub downloads, according to the available data) and Abstracts Views on Vision4Press platform.
Data correspond to usage on the plateform after 2015. The current usage metrics is available 48-96 hours after online publication and is updated daily on week days.
Initial download of the metrics may take a while.