Fig. 8
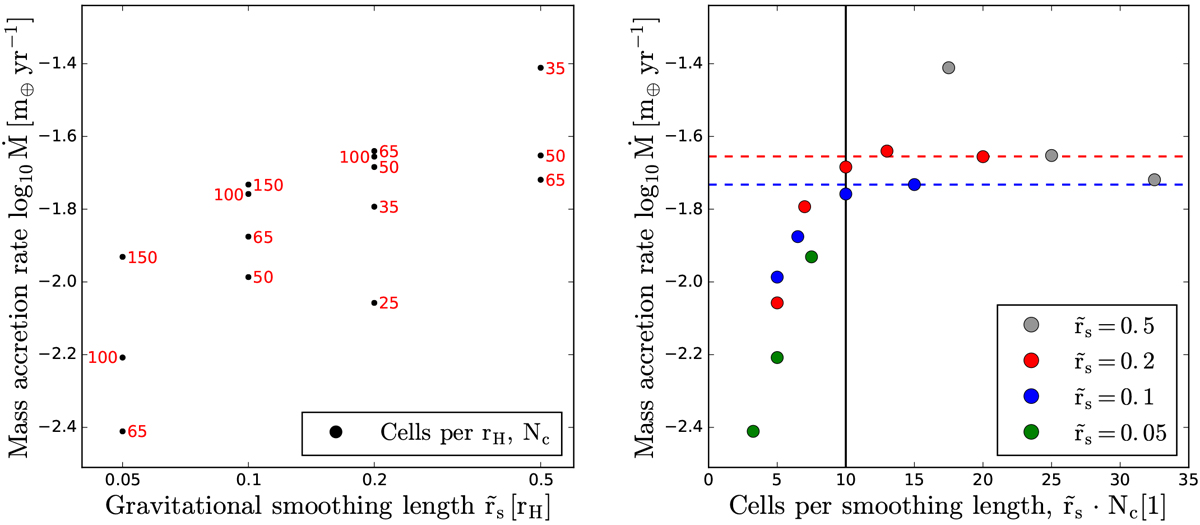
Our complete set of all simulation runs for constant κ = 0.01 cm2 g−1
where we varied the smoothing lengths as well as the numerical resolution, plotted as accretion rate vs. smoothing length (left) and as accretion rate vs. cells per smoothing length (right). All accretion rates shown are averages of the firstten accreting orbits after increasing the gravitational potential in Step C; see Figs. 5–7. Left: gas accretion rate inside the Hill-sphere as a function of the smoothing length, for varying resolution numbers. Each dot is a simulation run, with the resolution of the Hill-sphere indicated as cell numbers. It is evident that as resolution increases, accretion rates cluster closer together, indicating numerical convergence. However, more resolution is needed for deeper potential wells. Right: gas accretion rate inside the Hill-sphere plotted against the number of cells per smoothing length. Different colours indicate different smoothing lengths. It is evident that we need to resolve the smoothing length with at least ten cells before convergent results can be achieved (vertical lines). Thus, we define a “well-resolved simulation” as one that hits convergent values of
Ṁ at ![]() . Once converged, the accretion rates differ only slightly when deepening the gravitational potential, indicated with dashed lines.
. Once converged, the accretion rates differ only slightly when deepening the gravitational potential, indicated with dashed lines.
Current usage metrics show cumulative count of Article Views (full-text article views including HTML views, PDF and ePub downloads, according to the available data) and Abstracts Views on Vision4Press platform.
Data correspond to usage on the plateform after 2015. The current usage metrics is available 48-96 hours after online publication and is updated daily on week days.
Initial download of the metrics may take a while.