Fig. 4
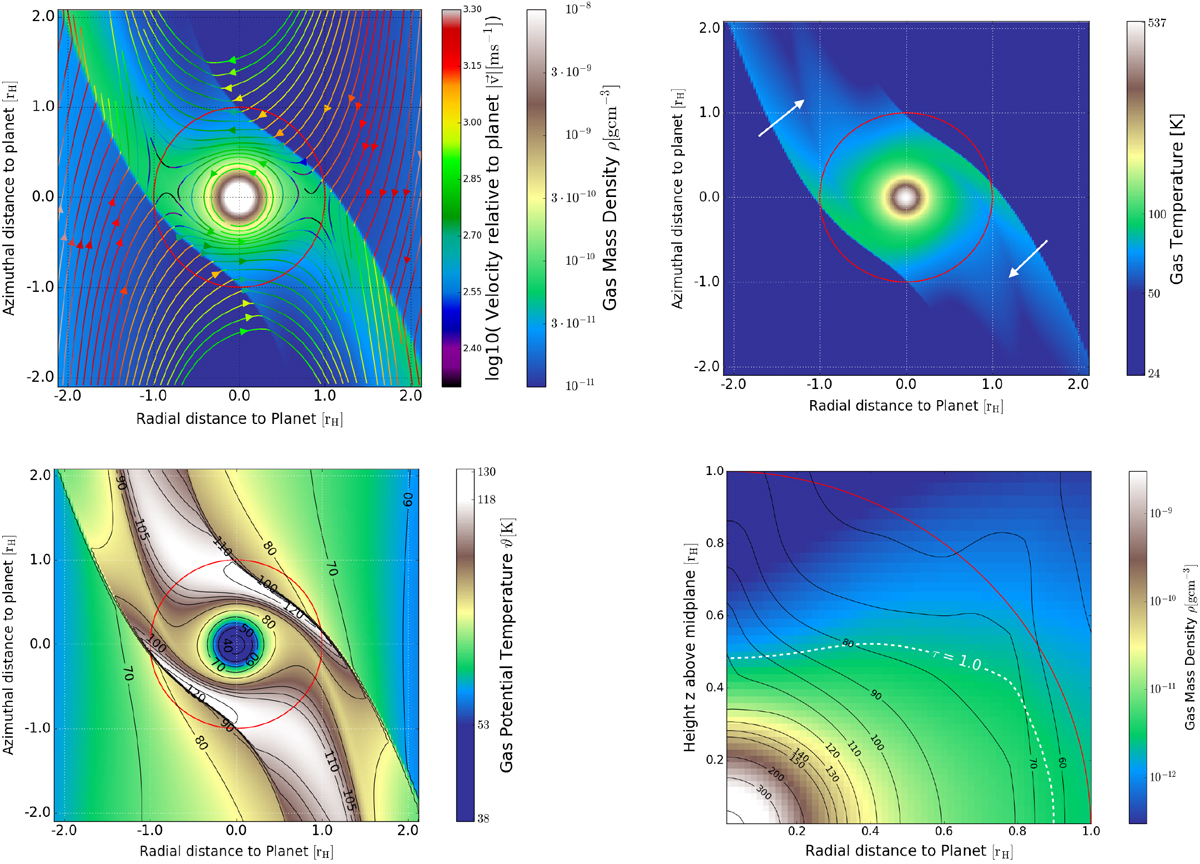
Overview and snapshot of typical midplane variables during gas accretion in Step C at the time of ten orbits for our nominal simulation run with constant opacity of κ = 0.01 cm2 g−1,
![]() , and Nc= 100. The Hill surface of the planet is approximated as a sphere, which is marked with the red circle. Top left: gas mass density in the midplane and stream lines overplotted with their respective momentary velocities. Spiral arm shocks launched near the Hill-sphere of the planet are clearly visible. The horseshoe flows interact with the shocks and are partially deflected. Colours indicate the stream line velocities and highlight flow deceleration at the shocks. Judging from stream lines only it would be impossible to say whether there is ongoing gas accretion, because most of the horseshoe mass merely passes through the planetary envelope, while only a minor fraction is accreted. The planetary gap is approximately ~ 2rH in width (as wide as the plot) and attains its unperturbed disc value at ~ 3rH. For comparison, the simulation domain in Step C extends radially to ±6rH. Top right: temperature structure in the midplane. The cold gas in the gap and the surrounding disc is clearly visible as dark background colour, while the planetary envelope and beyond is heated by compressional heat from accretion and the spiral shocks. A small fraction of internal energy is advected along the horseshoe orbits, visible in separate moderately warm (~ 80 K) arm structures marked with arrows. Bottom left: potential temperature ϑ overlaid with iso-ϑ contours. Entropy generation at the spiral arm shocks is strongest where horseshoe orbits hit the envelope radially. The central region cools most efficiently in the vertical direction, and therefore develops a drop in ϑ, indicating a radiative region. The innermost few pixels are subject to further flattening of the ϑ-profile, as herethe smoothing length provides a region essentially free of gravity. Bottom right: cylindric average of density as background colour and temperature in contours, as well as the τ = 1 surface, denoting the optically thin-thick transition. As this run has a constant opacity, the τ = 1 surface follows essentially an iso-density surface. This surface is bent towards the planet at small r, due to heavy cooling into the disc atmosphere and the consequential contraction. This plot only extends out to 1 rH as otherwise averaging effects smear out the physical properties outside the Hill-sphere.
, and Nc= 100. The Hill surface of the planet is approximated as a sphere, which is marked with the red circle. Top left: gas mass density in the midplane and stream lines overplotted with their respective momentary velocities. Spiral arm shocks launched near the Hill-sphere of the planet are clearly visible. The horseshoe flows interact with the shocks and are partially deflected. Colours indicate the stream line velocities and highlight flow deceleration at the shocks. Judging from stream lines only it would be impossible to say whether there is ongoing gas accretion, because most of the horseshoe mass merely passes through the planetary envelope, while only a minor fraction is accreted. The planetary gap is approximately ~ 2rH in width (as wide as the plot) and attains its unperturbed disc value at ~ 3rH. For comparison, the simulation domain in Step C extends radially to ±6rH. Top right: temperature structure in the midplane. The cold gas in the gap and the surrounding disc is clearly visible as dark background colour, while the planetary envelope and beyond is heated by compressional heat from accretion and the spiral shocks. A small fraction of internal energy is advected along the horseshoe orbits, visible in separate moderately warm (~ 80 K) arm structures marked with arrows. Bottom left: potential temperature ϑ overlaid with iso-ϑ contours. Entropy generation at the spiral arm shocks is strongest where horseshoe orbits hit the envelope radially. The central region cools most efficiently in the vertical direction, and therefore develops a drop in ϑ, indicating a radiative region. The innermost few pixels are subject to further flattening of the ϑ-profile, as herethe smoothing length provides a region essentially free of gravity. Bottom right: cylindric average of density as background colour and temperature in contours, as well as the τ = 1 surface, denoting the optically thin-thick transition. As this run has a constant opacity, the τ = 1 surface follows essentially an iso-density surface. This surface is bent towards the planet at small r, due to heavy cooling into the disc atmosphere and the consequential contraction. This plot only extends out to 1 rH as otherwise averaging effects smear out the physical properties outside the Hill-sphere.
Current usage metrics show cumulative count of Article Views (full-text article views including HTML views, PDF and ePub downloads, according to the available data) and Abstracts Views on Vision4Press platform.
Data correspond to usage on the plateform after 2015. The current usage metrics is available 48-96 hours after online publication and is updated daily on week days.
Initial download of the metrics may take a while.