Fig. 18
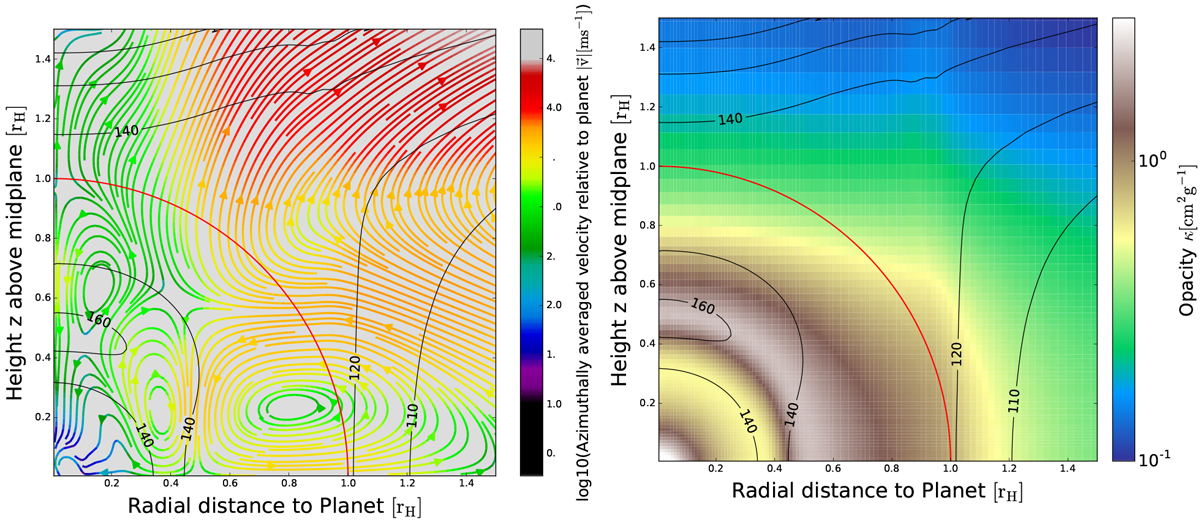
Potential temperature contours (in black) together with the average flows over ten orbits (left) and opacity map (right) for Bell and Lin opacities with ɛ = 1% and ![]() .
High optical depth in the vertical direction causes radiative transport to be inefficient, triggering a buoyant instability. This is visible in the irregular vortex structures that the time-average produces, compared to the simpler vortices in Fig. 15 and the potential temperature profile (contours) that is inverted in the z-direction within 0.5 rH < z < 1.0rH. The opacity map shows the colocation of potential temperature maxima with the opacity maxima corresponding to a pseudo-iceline according to Fig. 1. The radial location of the iceline is slightly distorted through the cylindrical averaging process. The net effect of this buoyant instability on the accretion rates in this particular run is weak, as only 10% of the net accretion rate falls in vertically, which is then blocked out.
.
High optical depth in the vertical direction causes radiative transport to be inefficient, triggering a buoyant instability. This is visible in the irregular vortex structures that the time-average produces, compared to the simpler vortices in Fig. 15 and the potential temperature profile (contours) that is inverted in the z-direction within 0.5 rH < z < 1.0rH. The opacity map shows the colocation of potential temperature maxima with the opacity maxima corresponding to a pseudo-iceline according to Fig. 1. The radial location of the iceline is slightly distorted through the cylindrical averaging process. The net effect of this buoyant instability on the accretion rates in this particular run is weak, as only 10% of the net accretion rate falls in vertically, which is then blocked out.
Current usage metrics show cumulative count of Article Views (full-text article views including HTML views, PDF and ePub downloads, according to the available data) and Abstracts Views on Vision4Press platform.
Data correspond to usage on the plateform after 2015. The current usage metrics is available 48-96 hours after online publication and is updated daily on week days.
Initial download of the metrics may take a while.