Fig. 16
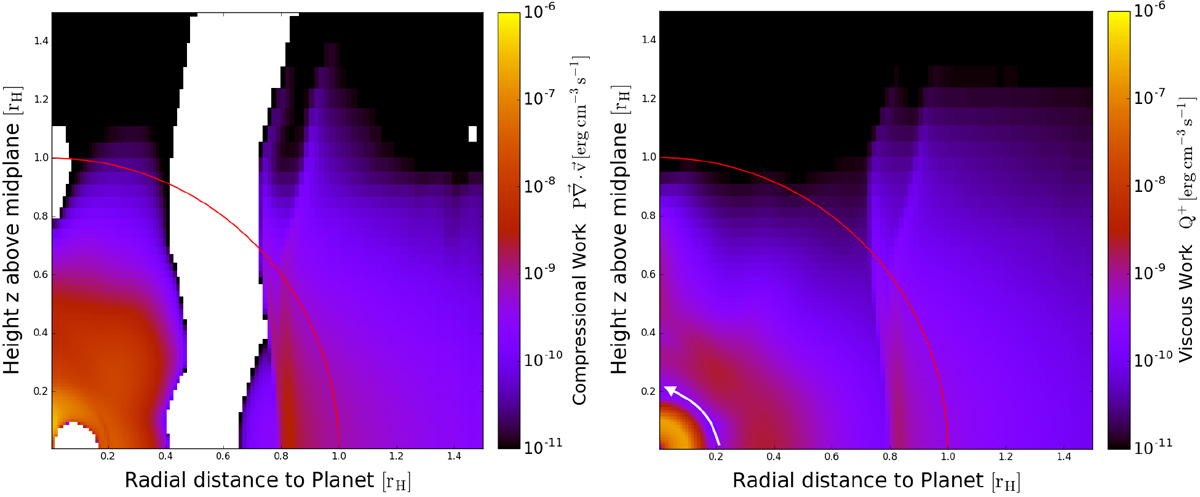
Cylindrically averaged compressional (left) and viscous work (right) in the envelope for
![]() ,
κ = 0.01 cm2 g−1, which is almost identical to the runs with
,
κ = 0.01 cm2 g−1, which is almost identical to the runs with ![]() in Figs. 14 and 15. We chose the run with
in Figs. 14 and 15. We chose the run with
![]() because the important physics is more visible. Most of the heating in the optically thin part of the envelope (for the thin–thick transition compare to Fig. 14) is generated at the spiral arm shocks (at r ≈ 0.8 rH), but is radiated away efficiently. The optically thick region of the envelope is affected by vertically infalling material, but is dominated by contraction of the inner, spherically symmetric region. White regions on the left indicate decompression, which plays only a minor role for the total luminosity in the envelope. The decompressing region within 0.4 < r∕rH < 0.7 is due to two different effects: At z ≤ 0.2 there is material from the horseshoe flows that decompresses as it falls into the inner envelope. For z > 0.2 the decompression is due to the global meridional flow. The vortical flow does not play a role for the compressional work. Weak decompression is seen above the planet at r ≈ 1.0 rH where strong cooling allows for gas to be in free-fall for a very short distance. The viscous work is volume-integrated a factor of approximately ten times less than the compressional work in the envelope outside of rs, and there is, as for the compressional work, no visible heating from the vortical flow. The flow inside of rs (indicated by the white arrow, also seen in Lambrechts & Lega 2017) is probably an artifact that is responsible for the behaviour seen in Fig. 10 and further discussed in the text. It is presumably the feature that we need to resolve properly with ten grid cells, as found before in Fig. 8.
because the important physics is more visible. Most of the heating in the optically thin part of the envelope (for the thin–thick transition compare to Fig. 14) is generated at the spiral arm shocks (at r ≈ 0.8 rH), but is radiated away efficiently. The optically thick region of the envelope is affected by vertically infalling material, but is dominated by contraction of the inner, spherically symmetric region. White regions on the left indicate decompression, which plays only a minor role for the total luminosity in the envelope. The decompressing region within 0.4 < r∕rH < 0.7 is due to two different effects: At z ≤ 0.2 there is material from the horseshoe flows that decompresses as it falls into the inner envelope. For z > 0.2 the decompression is due to the global meridional flow. The vortical flow does not play a role for the compressional work. Weak decompression is seen above the planet at r ≈ 1.0 rH where strong cooling allows for gas to be in free-fall for a very short distance. The viscous work is volume-integrated a factor of approximately ten times less than the compressional work in the envelope outside of rs, and there is, as for the compressional work, no visible heating from the vortical flow. The flow inside of rs (indicated by the white arrow, also seen in Lambrechts & Lega 2017) is probably an artifact that is responsible for the behaviour seen in Fig. 10 and further discussed in the text. It is presumably the feature that we need to resolve properly with ten grid cells, as found before in Fig. 8.
Current usage metrics show cumulative count of Article Views (full-text article views including HTML views, PDF and ePub downloads, according to the available data) and Abstracts Views on Vision4Press platform.
Data correspond to usage on the plateform after 2015. The current usage metrics is available 48-96 hours after online publication and is updated daily on week days.
Initial download of the metrics may take a while.