Fig. 15
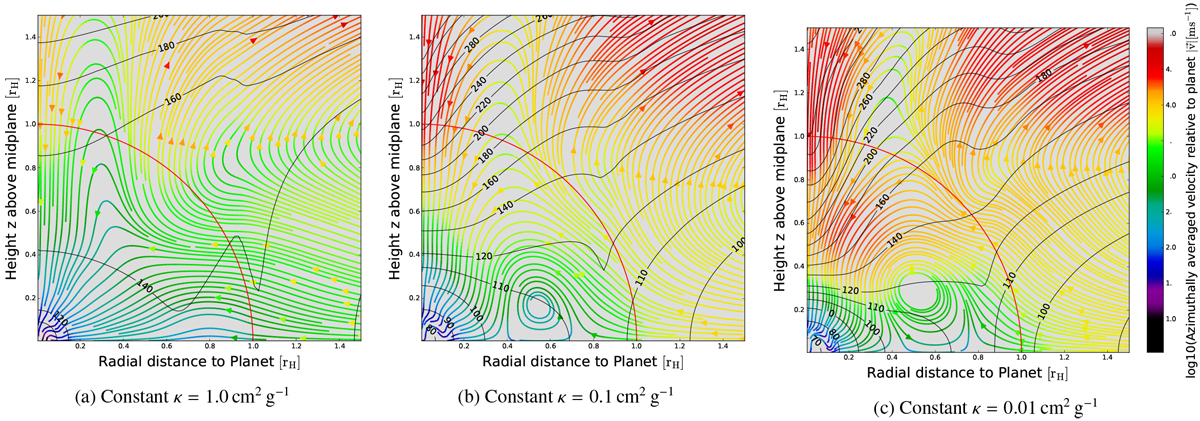
Temporally and cylindrically averaged flow stream lines with their colour-coded velocity relative to the planet and potential temperature ϑ in contours for well-resolved runs of opacity Set 1 and gravitational smoothing
![]() . The plot isslightly zoomed in compared to Fig. 14 in order to better feature the flow structures. Correlation of flows and isentropic surfaces is imperfect due to the averaging process. The vortex feature that appears for
κ = 0.1, 0.01 cm2 g−1
is a feature that exists in the x–z
plane, not in the x–y
plane. This feature stems from families of horseshoe trajectories that become distorted due to the bend in isocontours of ϑ. This again results from the baroclinicity of the envelope, which can be understood from Fig. 14 as the angle between iso-density and iso-temperature contours. Those results show that there is roughly a structure of three sections for accreting material: in the midplane, material is generally flowing into the Hill-sphere, excess material that cannot be cooled is ejected at mid-latitudes. Accretion from the top generally is seen in all cases, but amounts to only 10% of the net accretion.
. The plot isslightly zoomed in compared to Fig. 14 in order to better feature the flow structures. Correlation of flows and isentropic surfaces is imperfect due to the averaging process. The vortex feature that appears for
κ = 0.1, 0.01 cm2 g−1
is a feature that exists in the x–z
plane, not in the x–y
plane. This feature stems from families of horseshoe trajectories that become distorted due to the bend in isocontours of ϑ. This again results from the baroclinicity of the envelope, which can be understood from Fig. 14 as the angle between iso-density and iso-temperature contours. Those results show that there is roughly a structure of three sections for accreting material: in the midplane, material is generally flowing into the Hill-sphere, excess material that cannot be cooled is ejected at mid-latitudes. Accretion from the top generally is seen in all cases, but amounts to only 10% of the net accretion.
Current usage metrics show cumulative count of Article Views (full-text article views including HTML views, PDF and ePub downloads, according to the available data) and Abstracts Views on Vision4Press platform.
Data correspond to usage on the plateform after 2015. The current usage metrics is available 48-96 hours after online publication and is updated daily on week days.
Initial download of the metrics may take a while.