Fig. 14
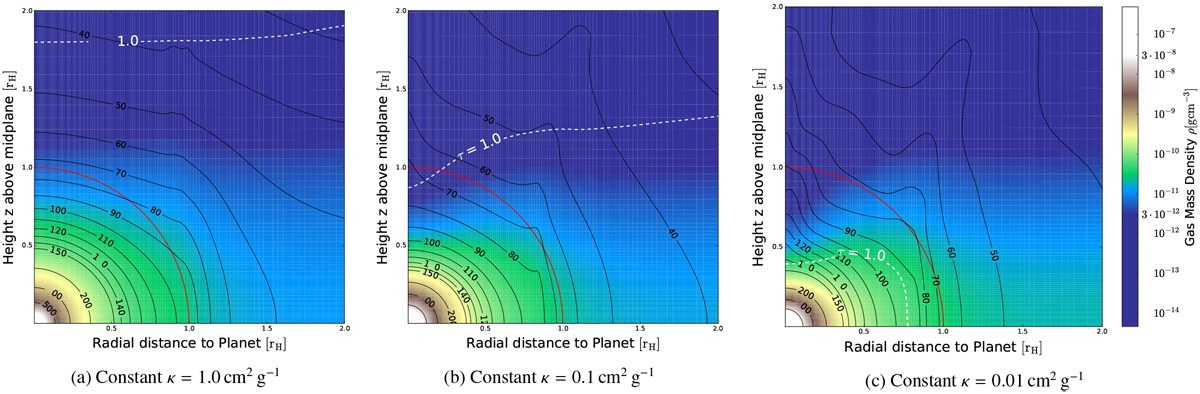
Time and cylindrically averaged density (as background colour) and temperature (in contours) distributions as functions of r and z and the optically thin–thick transition surface measured from the simulation boundary. Parameters are well resolved (Nc = 100) runs of opacity Set 1 and gravitational smoothing ![]() . The time-average ran over ten orbits with ten output samples per orbit. Near the planet, density and temperature are both radially distributed. Farther away from the planet, the density stratifies in
z
in order to connect to the gap. Moving outward radially in the disc midplane, the temperature becomes quasi-isothermal as
r
moves into the optically thin gap. In the z-direction however, heavy cooling bends the iso-T
planes upwards. The luminosity required for Eq. (16) is computed for the
κ = 0.01 cm2 g−1 cases in the approximation ∑dAσT4, which is possible as in those cases the planetary gap is optically thin. Luminosities and accretion rates vs. time are shown in Fig. 10.
. The time-average ran over ten orbits with ten output samples per orbit. Near the planet, density and temperature are both radially distributed. Farther away from the planet, the density stratifies in
z
in order to connect to the gap. Moving outward radially in the disc midplane, the temperature becomes quasi-isothermal as
r
moves into the optically thin gap. In the z-direction however, heavy cooling bends the iso-T
planes upwards. The luminosity required for Eq. (16) is computed for the
κ = 0.01 cm2 g−1 cases in the approximation ∑dAσT4, which is possible as in those cases the planetary gap is optically thin. Luminosities and accretion rates vs. time are shown in Fig. 10.
Current usage metrics show cumulative count of Article Views (full-text article views including HTML views, PDF and ePub downloads, according to the available data) and Abstracts Views on Vision4Press platform.
Data correspond to usage on the plateform after 2015. The current usage metrics is available 48-96 hours after online publication and is updated daily on week days.
Initial download of the metrics may take a while.