Fig. 13
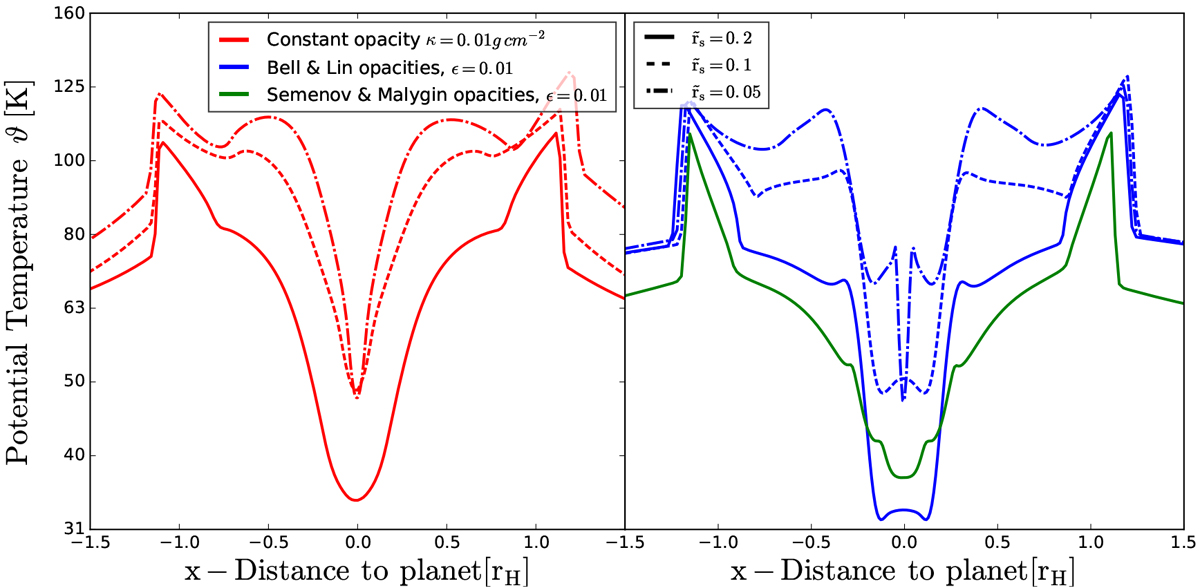
Potential temperatures in simulations with constant (left, red curves), Bell and Lin (right, black curves), and Malygin opacities (right, green curve) for different values of
![]() . We note that both plots share the two legends. The rs = 0.1 have Nc = 100 and correspond to the simulations shown in Fig. 12. A major difference between constant and Bell and Lin opacities is that close to the water-iceline at around
. We note that both plots share the two legends. The rs = 0.1 have Nc = 100 and correspond to the simulations shown in Fig. 12. A major difference between constant and Bell and Lin opacities is that close to the water-iceline at around
![]() there are indications of convective instability. The notion that this is related to the vicinity to the smoothing region is weakened, as the trend of inverted ϑ-profile continues as we deepen the potential in a well-resolved manner. The comparison to the more realistic Malygin et al. (2014)-opacities is done only for
there are indications of convective instability. The notion that this is related to the vicinity to the smoothing region is weakened, as the trend of inverted ϑ-profile continues as we deepen the potential in a well-resolved manner. The comparison to the more realistic Malygin et al. (2014)-opacities is done only for
![]() (compare the green and the straight black line). There, it is evident that the gradients in ϑ are weakened by a multi-step transition in κ.
(compare the green and the straight black line). There, it is evident that the gradients in ϑ are weakened by a multi-step transition in κ.
Current usage metrics show cumulative count of Article Views (full-text article views including HTML views, PDF and ePub downloads, according to the available data) and Abstracts Views on Vision4Press platform.
Data correspond to usage on the plateform after 2015. The current usage metrics is available 48-96 hours after online publication and is updated daily on week days.
Initial download of the metrics may take a while.