Fig. 1
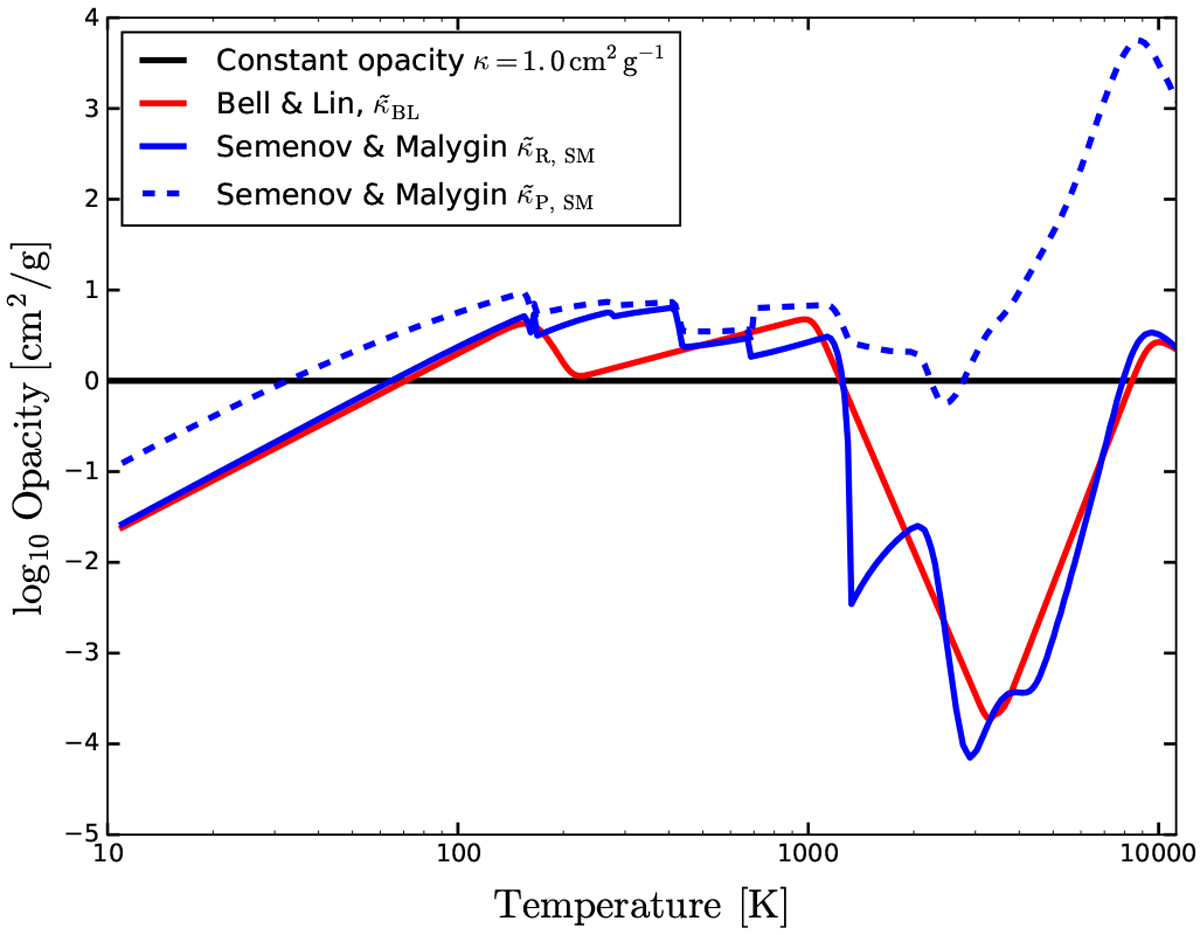
Opacity as a function of temperature. Constant opacities take the three different values 1.0, 0.1, and 0.01 cm2 g−1, where in the plot we indicate only 1.0 cm2 g−1. The second opacity set from Bell & Lin (1994) increases with temperature, shows a transition at the water-iceline at ≈ 200 K and a steep decline of the opacity once dust sublimation become relevant at temperatures of 1000 K. The third opacity set from Malygin et al. (2014) shows a much richer structure in terms of opacity transitions, which is due mainly to the various chemical constituents that Semenov et al. (2003) computed. The large difference between the Planck opacity and the Rosseland opacity mainly plays a role in optically thin regions. Midplane temperatures in our simulations at 5.2 AU without a planet range from 30 to 50 K.
Current usage metrics show cumulative count of Article Views (full-text article views including HTML views, PDF and ePub downloads, according to the available data) and Abstracts Views on Vision4Press platform.
Data correspond to usage on the plateform after 2015. The current usage metrics is available 48-96 hours after online publication and is updated daily on week days.
Initial download of the metrics may take a while.