Fig. 9
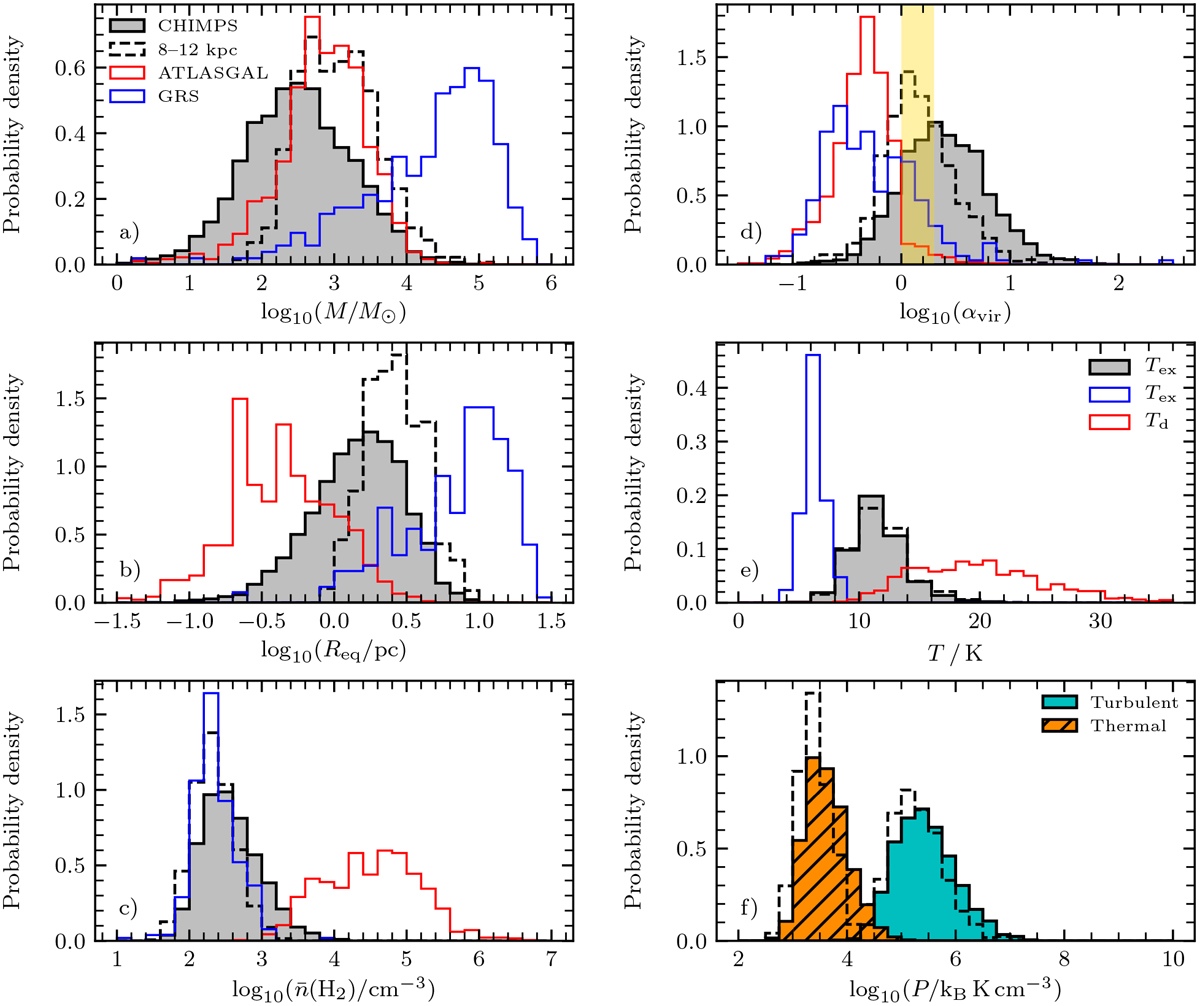
Panels a–d: distributions of total mass, equivalent radius, average number density, and virial parameters of the CHIMPS clumps (black histogram), GRS molecular clouds (blue) and ATLASGAL clumps (red).Panel e: mean excitation temperature distributions for the CHIMPS clumps and GRS molecular clouds, alongside the dust temperature distribution of ATLASGAL clumps (Urquhart et al. 2018), adopting the same colour coding as the preceding panels. Panel f: thermal and turbulent pressures for the CHIMPS clumps. The yellow shaded region in panel d shows the expected values for clumps in approximate virial equilibrium. In each panel, the empty dashed-outline histograms show the CHIMPS clump distributions for the corresponding property, but for the distance-limited sample with 8 ≤ dk ≤ 12 kpc.
Current usage metrics show cumulative count of Article Views (full-text article views including HTML views, PDF and ePub downloads, according to the available data) and Abstracts Views on Vision4Press platform.
Data correspond to usage on the plateform after 2015. The current usage metrics is available 48-96 hours after online publication and is updated daily on week days.
Initial download of the metrics may take a while.