Fig. 8
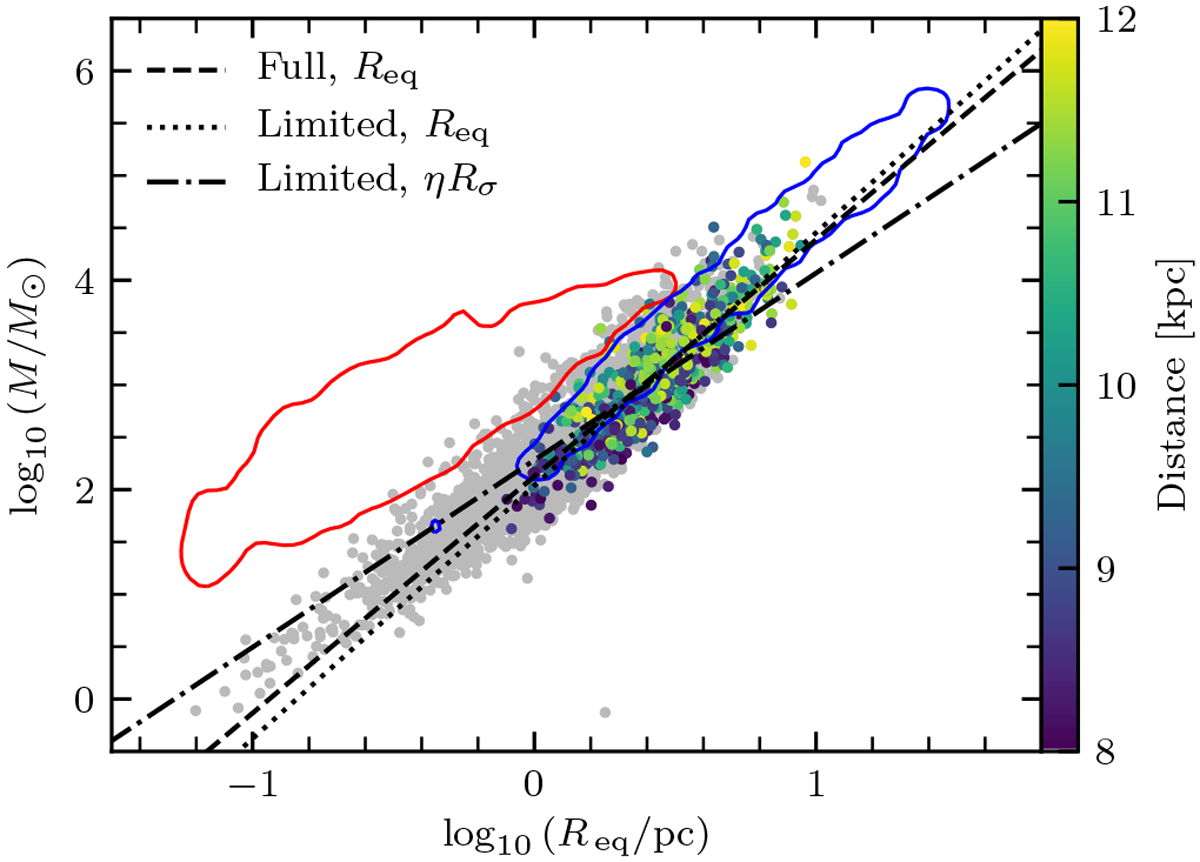
Mass–radius relationship for the CHIMPS clumps (coloured points) and, for comparison, we overlay contours containing 90% of the points in ATLASGAL (Urquhart et al. 2018) in red, and GRS (Roman-Duval et al. 2010) in blue. The coloured points are the distance-limited CHIMPS sample, while the grey points show the full sample. The dashed, dotted, and dot-dashed lines show the best-fit power-law to the various samples. The derived power-law fits are and Spearman’s rank correlation coefficients are listed in Table 3.
Current usage metrics show cumulative count of Article Views (full-text article views including HTML views, PDF and ePub downloads, according to the available data) and Abstracts Views on Vision4Press platform.
Data correspond to usage on the plateform after 2015. The current usage metrics is available 48-96 hours after online publication and is updated daily on week days.
Initial download of the metrics may take a while.