Fig. 7
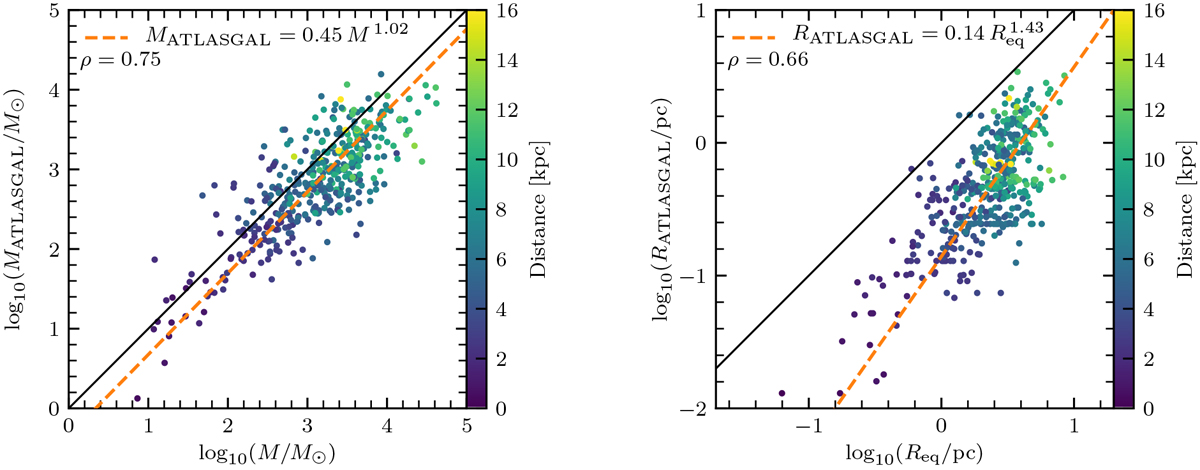
Comparison of the masses (left panel) and radii (right panel) of a sample of 412 CHIMPS clumps that match uniquely to ATLASGAL clumps. The ATLASGAL masses and radii have been rescaled to match the distance assigned to their corresponding CHIMPS association, and the colour of each point shows the source distance. The solid black line shows the 1:1 relationship, and the dashed orange line is the fitted relationship, and the Spearman’s rank correlation coefficient isshown.
Current usage metrics show cumulative count of Article Views (full-text article views including HTML views, PDF and ePub downloads, according to the available data) and Abstracts Views on Vision4Press platform.
Data correspond to usage on the plateform after 2015. The current usage metrics is available 48-96 hours after online publication and is updated daily on week days.
Initial download of the metrics may take a while.