Fig. 5
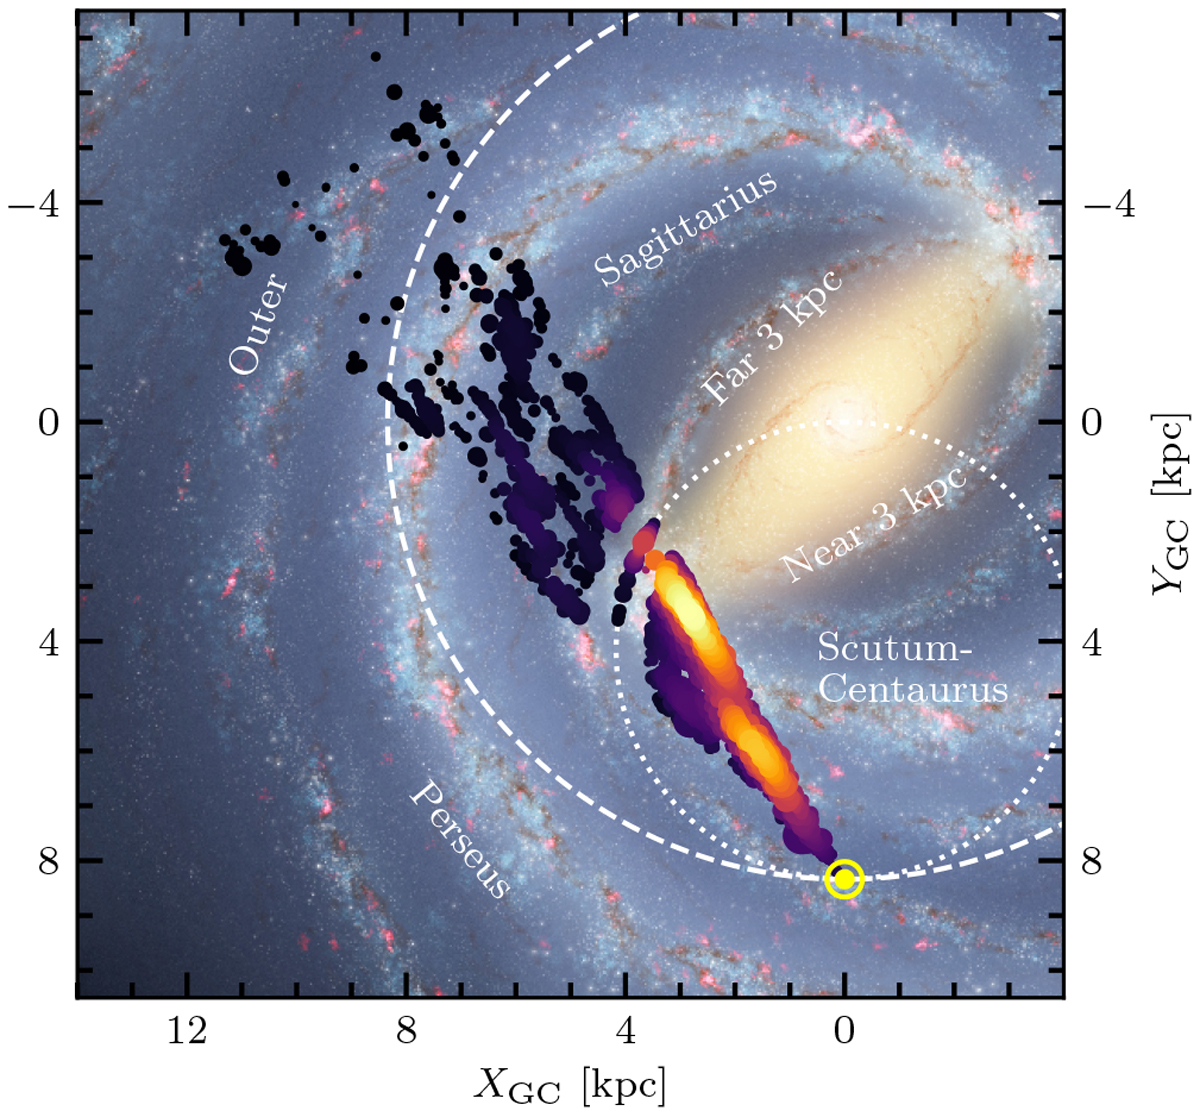
Top-down view of the distribution of the 4810 13CO (3–2) sources with kinematic heliocentric distances derived from the Reid et al. (2014) rotation curve. The relative brightness of the sources are indicated by the marker sizes, which have been normalised by the square-root of the integrated intensity after multiplying by the square of the distance. The relative source density is indicated according to the colour scale on the marked points, with black showing low density, and yellow showing high density. The background image was created by Robert Hurt of the Spitzer Science Center in consultation with Robert Benjamin at the University of Wisconsin-Whitewater and is described in Churchwell et al. (2009). The location of the Sun has been marked, and the Solar circle and locus of the tangent points have been marked as the white dashed, and dotted lines, respectively.
Current usage metrics show cumulative count of Article Views (full-text article views including HTML views, PDF and ePub downloads, according to the available data) and Abstracts Views on Vision4Press platform.
Data correspond to usage on the plateform after 2015. The current usage metrics is available 48-96 hours after online publication and is updated daily on week days.
Initial download of the metrics may take a while.