Free Access
Fig. 4
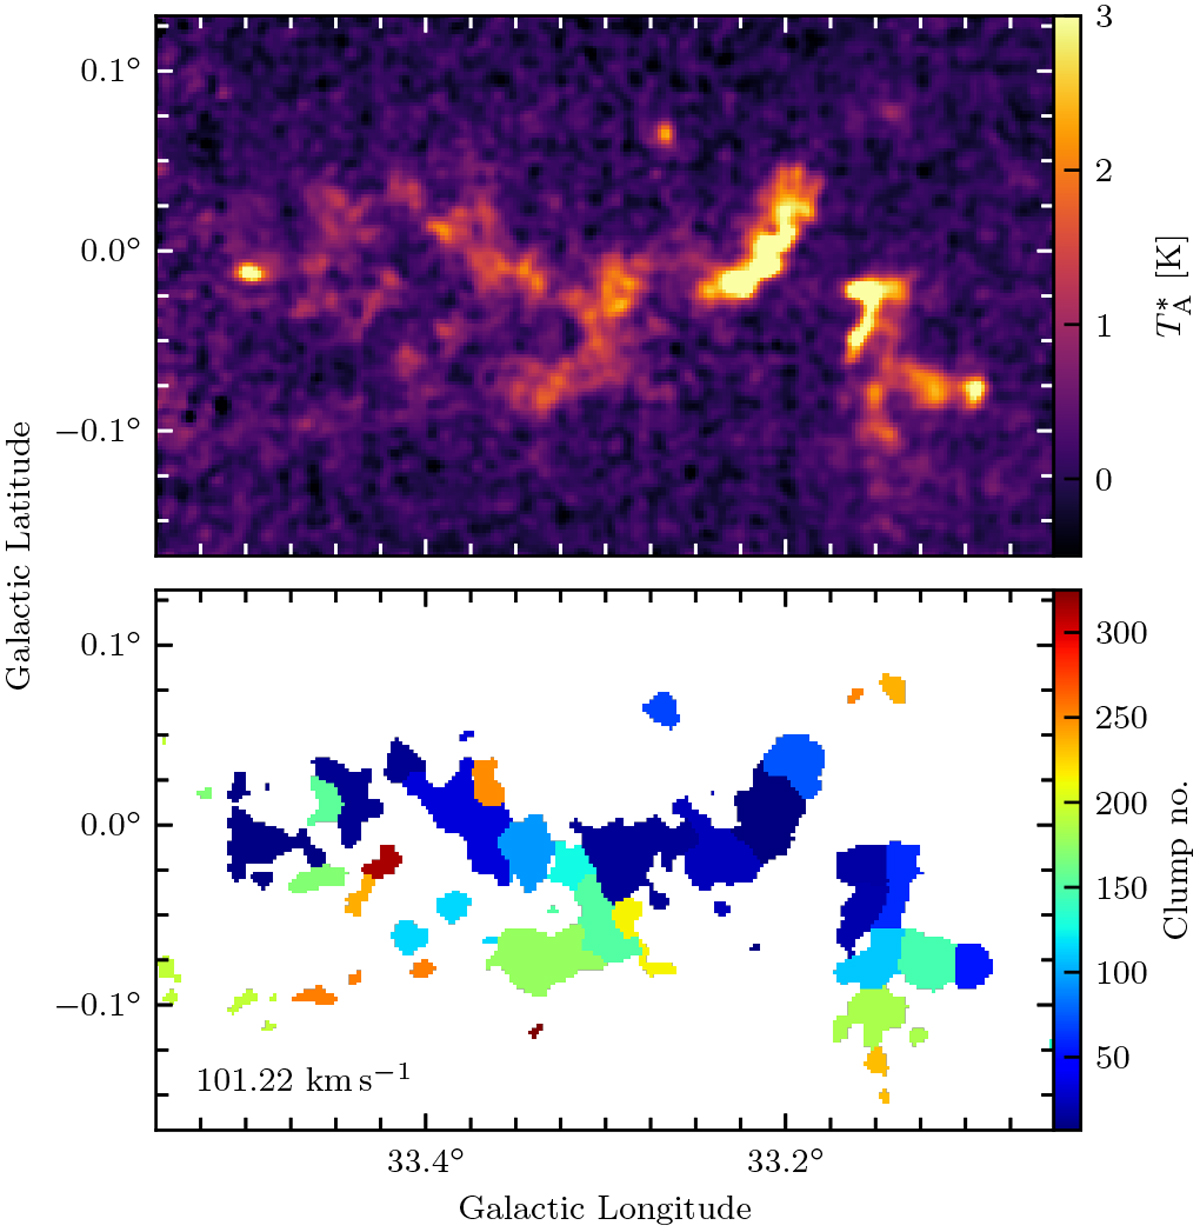
Example of the FELLWALKER source extraction, taken from Region 3 (see text). The top panel shows 13CO (3–2) emission in the 101.22 km s−1 velocity plane at 27.4-arcsec resolution, while the bottom panel shows the corresponding FELLWALKER clump-assignment mask, in which different colours represent different clumps.
Current usage metrics show cumulative count of Article Views (full-text article views including HTML views, PDF and ePub downloads, according to the available data) and Abstracts Views on Vision4Press platform.
Data correspond to usage on the plateform after 2015. The current usage metrics is available 48-96 hours after online publication and is updated daily on week days.
Initial download of the metrics may take a while.