Fig. 2
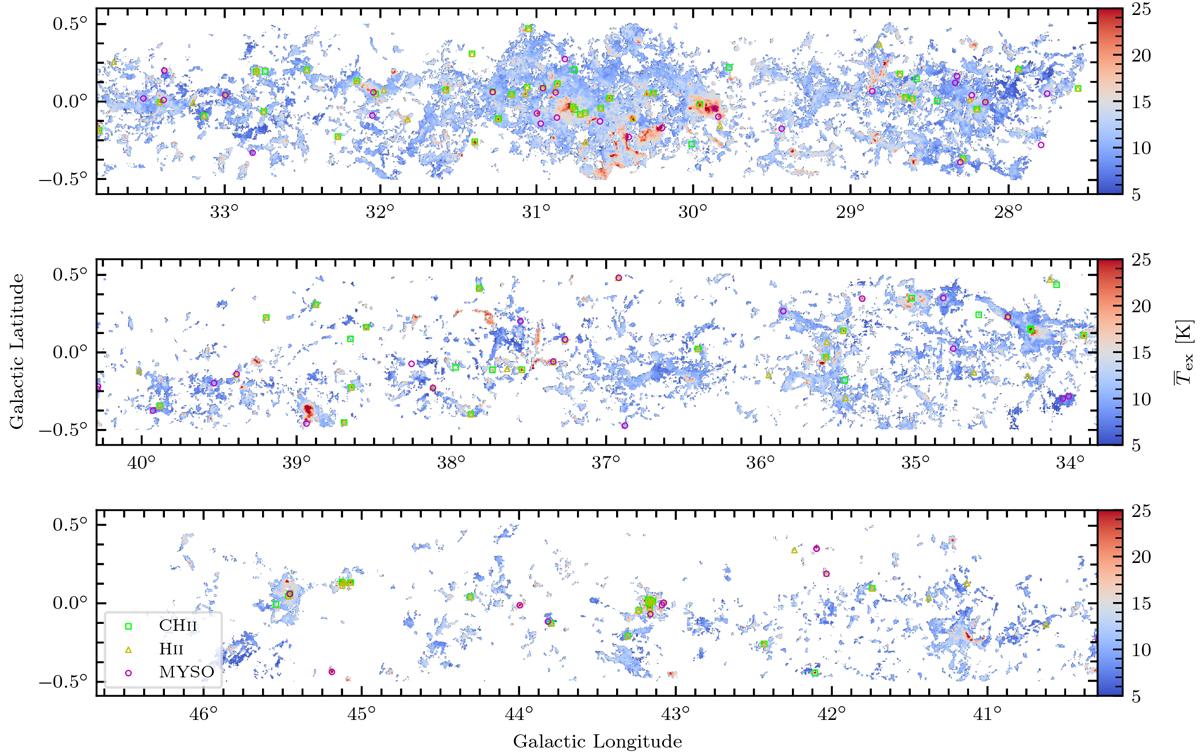
Weighted mean excitation temperature map for CHIMPS. For each pixel, the weighted mean excitation temperature, ![]() , has been calculated for the corresponding spectrum, with weightings given by the
, has been calculated for the corresponding spectrum, with weightings given by the
![]() of 13CO (3–2), and excluding all voxels for which S∕N < 5. Compact H II regions from CORNISH (Kalcheva et al. 2018) are overlaid as green squares, and H II regions and MYSOs from the rms survey (Lumsden et al. 2013) are shown as yellow triangles and magenta circles, respectively.
of 13CO (3–2), and excluding all voxels for which S∕N < 5. Compact H II regions from CORNISH (Kalcheva et al. 2018) are overlaid as green squares, and H II regions and MYSOs from the rms survey (Lumsden et al. 2013) are shown as yellow triangles and magenta circles, respectively.
Current usage metrics show cumulative count of Article Views (full-text article views including HTML views, PDF and ePub downloads, according to the available data) and Abstracts Views on Vision4Press platform.
Data correspond to usage on the plateform after 2015. The current usage metrics is available 48-96 hours after online publication and is updated daily on week days.
Initial download of the metrics may take a while.