Fig. 13
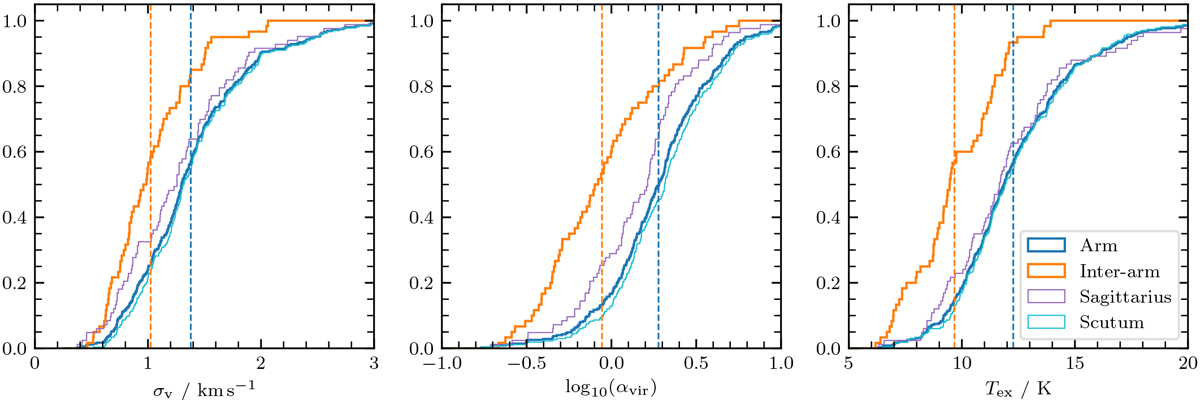
Cumulative distributions of the linewidths (left panel), mean excitation temperatures (middle panel), and the logarithm of the virial parameters (right panel) for spiral-arm and inter-arm clumps are shown as the solid blue and orange lines, respectively. The samples are distance-limited with 6 kpc ≤ dk < 9 kpc, and excludeclumps with masses below the nominal completeness limit at 9 kpc. The distributions for the Sagittarius and Scutum arms, which contribute to the spiral-arm distribution, are also shown as the thin purple and cyan lines, respectively.The dashed vertical lines show the means of the spiral-arm and inter-arm distributions.
Current usage metrics show cumulative count of Article Views (full-text article views including HTML views, PDF and ePub downloads, according to the available data) and Abstracts Views on Vision4Press platform.
Data correspond to usage on the plateform after 2015. The current usage metrics is available 48-96 hours after online publication and is updated daily on week days.
Initial download of the metrics may take a while.